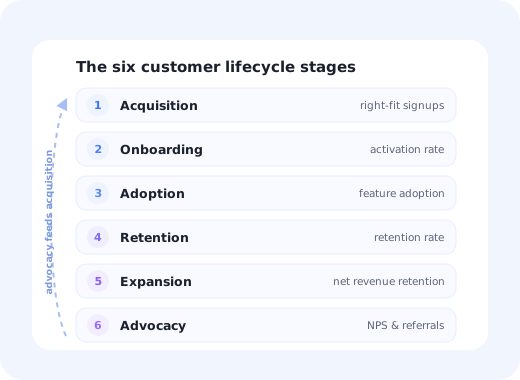
The customer lifecycle is one of those frameworks that everyone nods along to and almost nobody operates. It appears on a slide as a tidy circle with six arrows, gets agreed to in ten minutes, and is never mentioned again, because the diagram, as drawn, does not tell anyone what to do on Monday.
A lifecycle earns its place only when each stage carries three things: a question the business has to answer, a number that says whether it is being answered, and a person who answers for that number. Without those, "adoption" is a word on a wall.
This guide covers what the customer lifecycle actually is, how it differs from a customer journey map and a sales funnel, the six stages in order with the metric that governs each, the characteristic leak between every pair of stages, and the in-product experience that closes it.
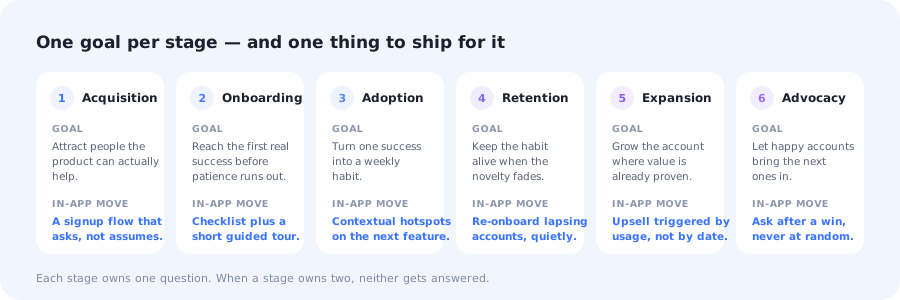
A stage without a specific in-app move is a label, not a stage.
Key Takeaways
- The customer lifecycle has six stages: acquisition, onboarding, adoption, retention, expansion and advocacy.
- One metric per stage. Two headline metrics means nobody can be held to either.
- Customers leak at the handovers, not inside the stages; measure the transitions, not just the totals.
- The lifecycle is the company's view; a journey map is the customer's. You need the first to find the problem and the second to explain it.
- Most stage work is in-app, because the product is the only channel every customer is guaranteed to open.
- Churn is not a stage; it is the outcome of a stage that stopped working weeks earlier.
What is the customer lifecycle?
Customer lifecycle definition: the full arc of a customer's relationship with your product, from first hearing about it to either advocating for it or leaving. In SaaS it is conventionally divided into six stages (acquisition, onboarding, adoption, retention, expansion and advocacy) each of which names one question the business must answer and one metric that says whether it is being answered.
The definition is deliberately operational. A lifecycle is not a description of how customers feel; it is a division of labour. Its value comes from being able to say "activation is fine, adoption is where we are losing them" with a number behind it, and then knowing whose week changes as a result.
This is also why the number of stages matters less than people argue about in workshops. Four stages, six stages or seven: the model works if every stage has a distinct question and a distinct owner, and it fails the moment two stages are answered by the same person looking at the same dashboard.
Customer lifecycle vs customer journey vs sales funnel
Three terms turn up interchangeably in the same meeting, and they answer genuinely different questions:
| Model | Whose view | Answers | Ends when |
|---|---|---|---|
| Customer lifecycle | The company's | Which stage of the relationship is underperforming, and who owns it? | Never: it loops through advocacy back into acquisition |
| Customer journey map | The customer's | What did this path feel like, step by step, and where did it hurt? | At the end of the mapped path |
| Sales funnel | The revenue team's | How many prospects convert at each step towards a purchase? | At the purchase |
The funnel stops at the sale, which is precisely where subscription businesses start earning. The lifecycle continues past it, which is the entire reason it exists as a separate model. And where the lifecycle tells you which stage is broken, a user journey map of that stage tells you why; the two are complements, not competitors.
A lifecycle without transitions instrumented is decorative. Knowing that 60% of accounts are "in adoption" is close to useless. Knowing how many accounts moved from onboarding into adoption last month, and how many did not move at all, is the number that changes decisions.
The 6 customer lifecycle stages
In order, with the transition that ends each one:
Acquisition: a stranger becomes a signup
Onboarding: a signup reaches a first real success
Adoption: one success becomes a repeated habit
Retention: the habit survives the loss of novelty
Expansion: a working account grows
Advocacy: a satisfied customer brings the next one
1. Acquisition
Acquisition ends the moment someone creates an account, and its quality is decided long before that. The trap is measuring it by volume: a channel that doubles signups while halving the share of people your product can actually help does damage that shows up two stages later, wearing a costume labelled "onboarding problem".
The practical fix is to judge acquisition by right-fit signups, the proportion that go on to activate, rather than by the raw count. That single change makes marketing and customer success stop arguing about lead quality in the abstract, because the argument now has a shared number. It also makes the signup flow a lifecycle asset rather than a form: asking one useful question at signup is worth more than three fields nobody reads.
🎯 Stage 1 at a glance
- Question it answers
- Are we attracting people this product can genuinely help?
- Metric
- Right-fit signups: signups that go on to activate, not total signups.
- Failure mode
- Volume goals met, fit quietly degrading, blamed on onboarding a month later.
- Usual owner
- Marketing, with the activation number visible to them.
2. Onboarding
Onboarding is the shortest and least forgiving stage in the lifecycle. It starts at signup and ends at the first success that means something to the user (the report generated, the data imported, the first teammate invited) not at the end of your tour. Everything before that success is cost the user is paying in the hope of a return.
The mistake that defines this stage is confusing completion with value. A user who clicked through eleven tooltips and has an empty workspace has completed onboarding and activated nothing. The number that matters is the activation rate, and the lever that moves it most reliably is shortening time to value, removing steps between the account and the first result rather than explaining those steps more clearly. For the full mechanics of this stage, the customer onboarding guide goes deeper than this section can.
🚀 Stage 2 at a glance
- Question it answers
- Do new accounts reach a first real success before their patience runs out?
- Metric
- Activation rate, plus median time to first value.
- Failure mode
- Measuring tour completion instead of the outcome the tour was supposed to produce.
- Usual owner
- Customer success or product, rarely both without friction.
3. Adoption
Adoption is where most of the lifetime value is quietly decided and where almost nobody is watching. An activated account has done the thing once; an adopted account does it every week, and has started using the second and third capability that make leaving expensive. The gap between those two states is where a large share of eventual churn is created, months before anyone cancels.
What this stage needs is not more education but better timing. A feature explained on day one to someone who has no use for it yet is noise; the same feature surfaced the first time the user hits the problem it solves is help. That is the whole argument for progressive onboarding, introducing capability when behaviour shows it has become relevant, and for treating feature discovery as an ongoing job rather than a first-week one. Measured properly, this stage is the subject of the product adoption discipline.
🔧 Stage 3 at a glance
- Question it answers
- Has a single success turned into a habit and a second use case?
- Metric
- Feature adoption and the share of accounts active weekly.
- Failure mode
- Treating adoption as an education problem and shipping a longer tour.
- Usual owner
- Product.
4. Retention
Retention is the long stage, and the one where nothing you did in week one still carries. It is also the stage where the signal arrives late: an account that cancels in March usually went quiet in January, and the cancellation is a formality. Which means retention work is mostly detection work, noticing the decline while it is still reversible.
Two instruments do most of the job. The retention curve tells you whether your product flattens into a stable base or bleeds continuously, which is a structural answer no monthly percentage can give. A customer health score turns that into an account-level early warning, so that an intervention lands in January rather than a save attempt in March. What the intervention should be is covered in the retention playbook; what it should not be is a discount offered to someone who has forgotten how the product works.
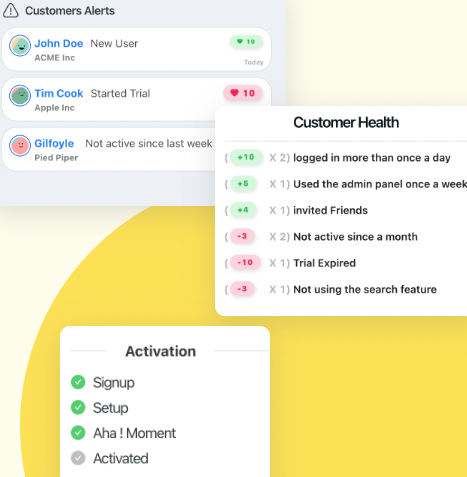
Retention is a detection problem first. The save attempt is only as good as the warning that triggered it.
🔒 Stage 4 at a glance
- Question it answers
- Does the habit survive once the product stops being new?
- Metric
- Retention rate, read against the shape of the retention curve.
- Failure mode
- Reacting at cancellation, when the decision was effectively made weeks earlier.
- Usual owner
- Customer success, with product on the causes.
5. Expansion
Expansion is where a subscription business earns the margin that acquisition spent. It also has the least tolerance for bad timing of any stage: an upgrade prompt shown to an account that has not yet succeeded reads as a shakedown, while the same prompt shown immediately after a genuine win reads as a reasonable next step.
The rule that keeps this honest is to trigger on usage rather than on the calendar: the account approaching a limit, inviting a fifth teammate, or using a capability that the next tier does better. That is the difference between an in-app upsell and an interruption, and it is why net revenue retention is the metric for this stage: it counts expansion net of the contraction and churn that a badly timed campaign creates.
📈 Stage 5 at a glance
- Question it answers
- Are accounts that already get value growing in seats, usage or plan?
- Metric
- Net revenue retention.
- Failure mode
- Campaigns timed by date rather than by evidence of value received.
- Usual owner
- Sales or growth, on product signals.
6. Advocacy
Advocacy is the stage most lifecycle diagrams draw and least measure. It is what closes the loop: satisfied accounts refer, review, take the reference call, and lower the cost of the acquisition stage they feed back into. Treated as an afterthought, it produces a quarterly review-request campaign that annoys everyone; treated as a stage, it has a trigger and a metric like every other.
The trigger is a completed win: a milestone reached, a report shipped, a team fully onboarded. Asking then is a different question from asking on the fifteenth of the month. NPS is the standard instrument here, and it is worth more as a routing mechanism than as a headline number: promoters get the referral ask, detractors get a conversation before they become a churn statistic. Your power users are the population this stage lives on.
⭐ Stage 6 at a glance
- Question it answers
- Are happy customers bringing in the next ones?
- Metric
- NPS and referral rate.
- Failure mode
- Asking on a schedule instead of after a win, which lowers both the response and the answer.
- Usual owner
- Shared, which is why it needs naming explicitly.
What about churn? Plenty of models add a seventh stage for churn or off-boarding. It is more useful to treat churn as the outcome of a stage that stopped working rather than a stage of its own: an account does not enter "the churn stage", it exits retention. Understanding why is the job of churn analysis, and a graceful cancellation flow that captures a real reason is worth more than a stage box on a diagram.
Customer lifecycle metrics by stage
One metric per stage, with the diagnostic that explains it when it moves. Resist the urge to add a second headline number to any row: a stage measured by two numbers is a stage nobody can be held to.
| Stage | Primary metric | Supporting diagnostic | What a drop usually means |
|---|---|---|---|
| Acquisition | Right-fit signups | Activation rate by channel | A channel is delivering volume without fit |
| Onboarding | Activation rate | Time to first value; step-level drop-off | One step in the setup path is doing the damage |
| Adoption | Feature adoption | Weekly active accounts; breadth of features used | Users never met the second use case |
| Retention | Retention rate | Retention curve shape; health score distribution | The curve never flattened: a structural problem, not a campaign one |
| Expansion | Net revenue retention | Expansion vs contraction split | Growth is being cancelled out by downgrades |
| Advocacy | NPS | Referral rate; review volume | You are asking on a schedule, not after a win |
Stage metrics only become operational once they are split by cohort and segment. A blended activation rate that has been flat for six months routinely hides one segment improving sharply while another collapses, and the collapsing one is usually the segment that pays.
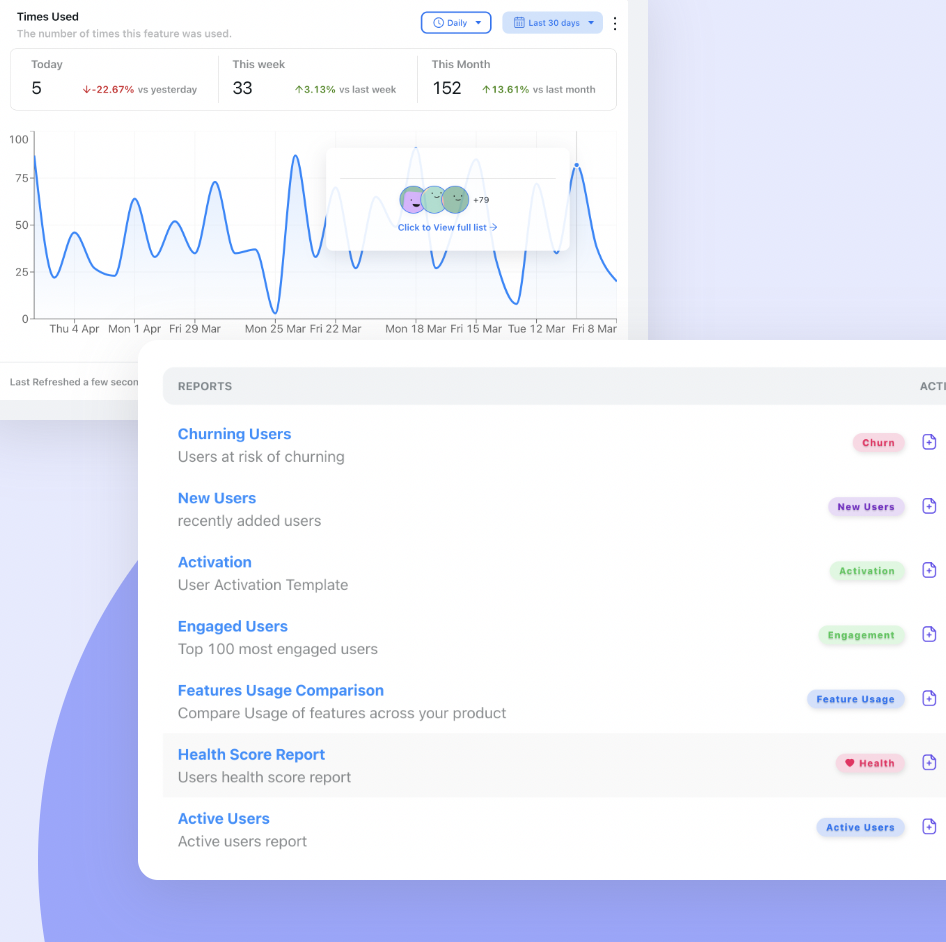
One metric per stage, split by cohort. Blended numbers are where dying segments hide.
Where the lifecycle actually leaks
Customers rarely fail inside a stage. They fail at the handover between two, the moment where one team's job is finished and the next team's has not visibly started. There are five of these seams, and each has a characteristic symptom.
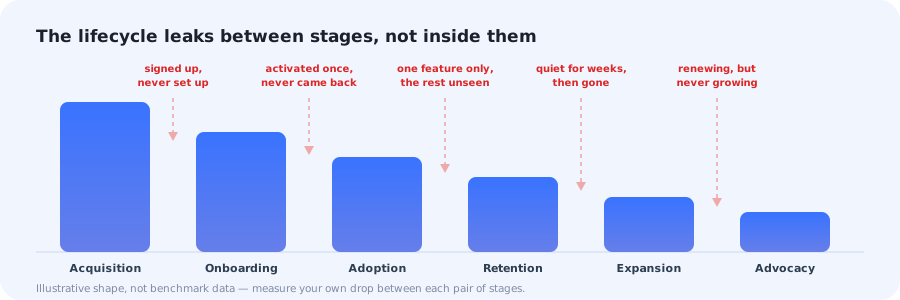
Five seams, five symptoms. Instrument the transitions and the diagram starts paying for itself.
-
Acquisition → onboarding: signed up, never set up
The account exists and nothing has happened in it. Usually a first screen that asks for work before it has shown any value, or a first empty state that explains what the screen is instead of offering the one action worth taking.
-
Onboarding → adoption: activated once, never returned
They reached first value and did not come back for a second. The first session succeeded; nothing gave them a reason to open the product on day three. A checklist that ends at "you're all set" ends the relationship there too.
-
Adoption → retention: one feature only
A steady, shallow user, the profile that looks healthy on a login report and cancels without warning. Single-feature accounts have nothing holding them when a cheaper option appears.
-
Retention → expansion: quiet, then gone
Usage decays over weeks and the first anyone hears of it is the cancellation email. This is a detection failure, not a persuasion failure, and it is fixed with health scoring rather than with better save offers.
-
Expansion → advocacy: renewing, never growing
The account is happy, stable and completely static, and nobody has ever asked it for a referral, a review or a second team. Advocacy that is never triggered simply does not happen.
The orphan periods. The week after signup and the month after a renewal are the two stretches most likely to belong to nobody. Marketing has moved on, customer success has not been triggered yet, and the account is left to progress by itself. Naming an owner for those two windows fixes more lifecycle problems than redrawing the diagram ever will.
Do's and don'ts
✅ Do
- Give every stage one metric and one owner
- Instrument the transitions between stages
- Judge acquisition by activation, not volume
- Trigger expansion on usage, not on dates
- Split every stage metric by cohort and segment
- Ask for advocacy right after a win
- Name an owner for the week after signup
❌ Don't
- Draw the circle and stop there
- Count tour completion as activation
- Give one stage two headline metrics
- Treat churn as a stage to manage
- Explain features nobody needs yet
- Wait for cancellation to intervene
- Run advocacy campaigns on a calendar
Managing the customer lifecycle with Kompassify
Most lifecycle work is in-app work, for a simple reason: the product is the only channel every customer is guaranteed to open. Kompassify is a no-code digital adoption platform for SaaS teams, so each stage can get its own experience without a sprint of product engineering.
- Acquisition: ask one multi-choice question at the start and route each answer to a different first run, so fit is established in the product rather than guessed from the channel.
- Onboarding: a setup onboarding checklist plus a short product tour that ends at a real outcome, not at the last tooltip.
- Adoption: hotspots and contextual tips on the second and third capability, shown when behaviour says they have become relevant.
- Retention: re-onboarding flows aimed at accounts whose usage is declining, and an in-app survey to find out what changed before they decide.
- Expansion: usage-triggered in-app announcements for accounts approaching a limit or already behaving like the next tier.
- Advocacy: an NPS survey fired after a completed milestone, routing promoters to a referral ask and detractors to a conversation.
- Across every stage: compare progression per segment in product analytics, so a stage that is failing for one group is visible before it becomes a churn number.
Free up to 100 monthly active users, paid plans from $129/month, GDPR-compliant with EU hosting.
Give every lifecycle stage its own experience
Onboard, adopt, retain, expand: each with the in-app flow that stage needs, and none of it requiring product code.
Start for Free →Frequently Asked Questions
What is the customer lifecycle?
The customer lifecycle is the full arc of a customer's relationship with your product, from the moment they first hear about it to the moment they either advocate for it or leave. In SaaS it is usually described in six stages: acquisition, onboarding, adoption, retention, expansion and advocacy. Its purpose is operational rather than descriptive: each stage names one question the business has to answer, one metric that says whether it is being answered, and one team that owns it.
What are the stages of the customer lifecycle?
Six, in order. Acquisition, where a stranger becomes a signup. Onboarding, where a signup reaches a first real success. Adoption, where a single success becomes a repeated habit. Retention, where the habit survives the loss of novelty. Expansion, where a working account grows in seats, usage or plan. Advocacy, where a satisfied customer brings in the next one. Some teams add a seventh, churn or off-boarding, to describe the exit, which is better treated as the outcome of a failed stage than a stage of its own.
What is the difference between the customer lifecycle and the customer journey?
The customer lifecycle is the company's view of the relationship, divided into stages a business can staff, measure and budget for. A customer journey map is the customer's view of a specific path, with the steps, thoughts and frustrations they experience along the way. The lifecycle tells you which stage is underperforming; a journey map of that stage tells you why. Teams that own only the lifecycle tend to know exactly where they lose people and not at all what it felt like to be one of them.
Which metric should you use for each customer lifecycle stage?
One per stage. Acquisition is measured by right-fit signups rather than raw volume, onboarding by activation rate, adoption by feature adoption and weekly active accounts, retention by retention rate and its curve, expansion by net revenue retention, advocacy by NPS and referral rate. Tracking one metric per stage matters more than which exact metric you pick, because a stage with two headline metrics is a stage nobody can be held to.
What is customer lifecycle management?
Customer lifecycle management is the practice of running each stage deliberately instead of hoping accounts progress on their own: naming the owner and the metric for every stage, instrumenting the transitions between them, and shipping something specific when an account stalls. In practice most of that work is in-app: a checklist during onboarding, a contextual tip during adoption, a re-onboarding flow for a lapsing account, because the product is the only channel every customer is guaranteed to open.
Where do SaaS companies lose customers in the lifecycle?
Almost always at the handovers, not inside the stages. Accounts sign up and never finish setup, activate once and never return, adopt a single feature and never see the rest, go quiet for weeks before cancelling, or renew year after year without ever expanding. Each of those is a transition failure between two stages, which is why measuring stages in isolation makes a company feel healthy while its cohorts thin out.
How long does each customer lifecycle stage last?
It depends on the product, and the useful move is to measure your own rather than adopt someone else's numbers. A self-serve tool may compress acquisition to adoption into a single afternoon, while an enterprise rollout can spend a quarter in onboarding alone. What is consistent is the shape: onboarding is the shortest and least forgiving stage, adoption is where most of the value is decided, and retention is long enough that nothing you do in week one will carry it unaided.
Who owns the customer lifecycle?
Marketing usually owns acquisition, customer success owns onboarding and retention, product owns adoption, sales or growth owns expansion, and advocacy tends to be shared. The failure mode is not the split itself but the unowned space between two teams: the week after signup and the month after a renewal are the two most common orphan periods, and both are where accounts quietly stop progressing.