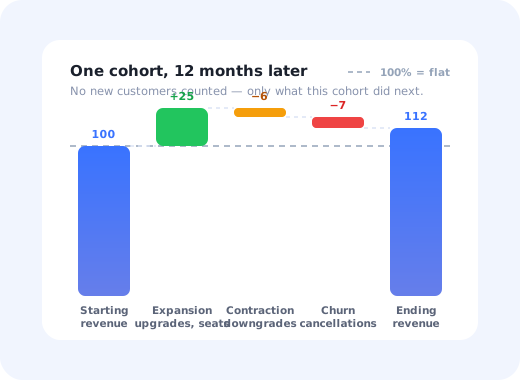
Two SaaS companies each closed €2M of new business last year. The first also lost €600K from accounts it already had. The second grew its existing base by €400K without signing anyone new. Same sales team performance, completely different companies.
Net revenue retention is the number that tells them apart. It ignores new logos entirely and asks one question about the customers you already won: a year on, are they paying you more or less?
This guide covers the NRR definition and formula, a worked example, what a good net revenue retention rate looks like by segment, how NRR differs from GRR and NDR, the five ways the calculation gets flattered, and the product changes that actually move it.
Key Takeaways
- NRR measures one cohort of existing customers. New customers never enter the formula, on either side of the division.
- Above 100% means the base grows on its own. Expansion more than covers churn and downgrades, so revenue rises before a single new deal closes.
- NRR and NDR are the same metric. Two names, one calculation, but the definitions behind them differ between companies, so always check the maths.
- Always publish GRR next to it. A strong NRR on a weak GRR means a few expanding accounts are hiding a leak.
- Expansion is an adoption event first. Accounts upgrade when they have outgrown a plan, not when a rep calls at renewal.
- Most of NRR is decided in the first 90 days. Accounts that never reached a second successful workflow almost never expand later.
What is net revenue retention?
Net revenue retention definition: the percentage of recurring revenue retained from an existing set of customers over a period, after expansion, contraction and churn, excluding any revenue from newly acquired customers. An NRR of 112% means that group is now paying 12% more than it was at the start of the period.
The mental model that makes it click: pick every customer you had on 1 January, then close the door. No new logos are allowed in for the rest of the year. In December, add up what that same group pays you. NRR is that figure divided by what they paid in January.
This is why NRR is the metric investors reach for first. Growth from new customers is bought: it costs you sales and marketing spend, and it stops the moment you stop paying. Growth from the existing base is compounding: it arrives whether or not you close a deal that quarter, and it is the clearest available evidence that the product delivers more value the longer people use it.
The NRR formula
NRR = Starting revenue + expansion − contraction − churn Starting revenue × 100
Same customers on both sides of the division. New customers are excluded entirely.
Each term means something specific:
- Starting revenue: the recurring revenue (ARR or MRR) of the cohort on day one of the period.
- Expansion: upgrades to a higher tier, extra seats, usage above an included allowance, and paid add-ons.
- Contraction: downgrades, removed seats and reduced usage commitments from accounts that stayed.
- Churn: the recurring revenue of accounts that cancelled outright.
A worked example
A company starts the year with €1,000,000 of ARR across 200 customers. Over twelve months, those accounts add €250,000 in upgrades and seats, cut €60,000 through downgrades, and €70,000 walks out the door with cancelled accounts.
(1,000,000 + 250,000 − 60,000 − 70,000) ÷ 1,000,000 = 112%
The company also signed €800,000 of new business that year. It changes total growth; it does not touch NRR.
Note what 112% actually buys you. If nothing else changed, no new customers at all, that base grows 12% a year by itself. Combine that with even modest acquisition and the compounding gets dramatic. Flip it to 88% and every new deal you sign is partly refilling a bucket that leaks faster than you can pour.
NRR vs GRR vs NDR vs logo retention
Four terms circle the same territory, and they are constantly used interchangeably in board decks where they should not be.
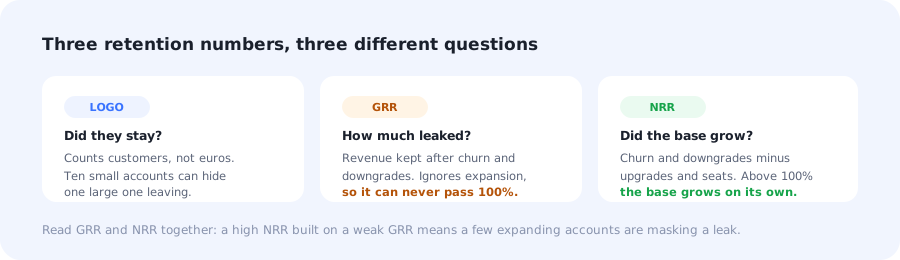
Logo retention counts customers, GRR counts what leaked, NRR counts whether the base grew.
| Metric | What it counts | Can it exceed 100%? | Best used for |
|---|---|---|---|
| NRR (net revenue retention) | Churn + contraction + expansion | Yes | Is the installed base growing on its own? |
| GRR (gross revenue retention) | Churn + contraction only | No | How much revenue is genuinely leaking? |
| NDR (net dollar retention) | Identical to NRR | Yes | The same metric, usually in US reporting |
| Logo retention | Customer count only | No | Are accounts staying, regardless of size? |
NRR and NDR are the same calculation. The naming is regional habit, not a methodological difference. What genuinely does differ between two companies quoting "NDR" is the definition underneath: annual or monthly period, ARR or MRR, whether professional services and one-off fees are included, and how mid-period upgrades are timed. Ask for the maths, not the acronym.
NRR without GRR is close to useless. An NRR of 115% built on a GRR of 78% is a very different business from 115% on a GRR of 96%. The first is a handful of expanding accounts papering over heavy churn; the moment those accounts stop growing, the leak is fully exposed. Report the pair, always.
Note too that all of these are revenue measures. They tell you nothing about whether people are actually using the product, which is why they need to be read alongside user retention and a retention curve. An annual contract keeps paying for months after the team inside has quietly stopped logging in; the revenue looks retained right up until renewal day.
What is a good net revenue retention rate?
The honest answer is that it depends almost entirely on who you sell to and how your contracts are shaped. A self-serve product sold to freelancers and an enterprise platform sold on seats and consumption have structurally different ceilings, and comparing them tells you nothing.
| Segment | Commonly cited NRR | Why the range sits there |
|---|---|---|
| SMB / self-serve | 85–100% | High logo churn, small accounts, little room to expand within a single customer. |
| Mid-market | 100–110% | Team-level rollout gives seat expansion, but budgets are still reviewed hard each year. |
| Enterprise | 110–125% | Multi-team rollout, seat growth and usage tiers compound inside one account. |
| Usage-based pricing | Widest spread | Expands and contracts with the customer's own volume: excellent in growth years, brutal in flat ones. |
Treat those as orientation, not targets. Reported figures vary between benchmark sources because the definitions vary, and the headline numbers quoted in fundraising posts are usually top-decile enterprise companies. Three comparisons are more useful than any of them:
- Your own trend over eight quarters, annotated with what shipped and what changed in pricing.
- Your best segment versus your worst. If one plan or industry sits 25 points above another, you have found where the product genuinely lands, and a segmentation question worth answering.
- Expanded accounts versus flat ones. What did the expanders do in their first 90 days that the flat ones did not? That comparison is the whole playbook.
The 100% line is the one that matters. Below it, your acquisition spend is partly replacing revenue you already had. Above it, every euro of acquisition lands on a base that is already growing. Most of the value of moving 95% → 105% is not the ten points; it is crossing the line where growth compounds.
Five ways NRR gets flattered
NRR is one of the easiest metrics to accidentally overstate, because almost every ambiguous choice in the calculation happens to push it up.
1. Churned accounts quietly leave the cohort
If an account cancels in March and someone drops it from the starting cohort because "it's not a customer anymore", NRR jumps. The cohort must be fixed on day one and never edited. Whoever was in it stays in it, at zero if they left.
2. New customers sneak into the numerator
Upsells to accounts acquired during the period are new business, not expansion. Including them is the most common spreadsheet error in the calculation, and it is invisible unless someone checks the account start dates.
3. One whale is carrying the number
A single account tripling its contract can pull company-wide NRR above 100% while the other 199 customers contract. Always look at the median account alongside the aggregate, and check what NRR looks like with your largest expansion excluded. If the answer moves more than a few points, you have a concentration story, not a retention story.
4. Monthly NRR presented as annual
A monthly NRR of 101% is not an annual 112%, and it should never be multiplied or compounded into one. Monthly figures are a useful early-warning signal, especially on monthly plans, but they are noisy and they miss the annual renewal moment where most contraction is actually decided.
5. Price increases counted as expansion
An across-the-board list-price rise lifts NRR without a single customer getting more value. It is legitimate revenue, but it is not evidence of adoption, so track it as its own line. Otherwise you will read a pricing change as product-market fit and repeat it until customers leave.
How to improve net revenue retention
NRR is a lagging indicator of adoption. You cannot raise it directly; you raise it by changing how many people inside each account get value, how quickly, and how visible the next step up is. Sales motions capture expansion; the product creates it.
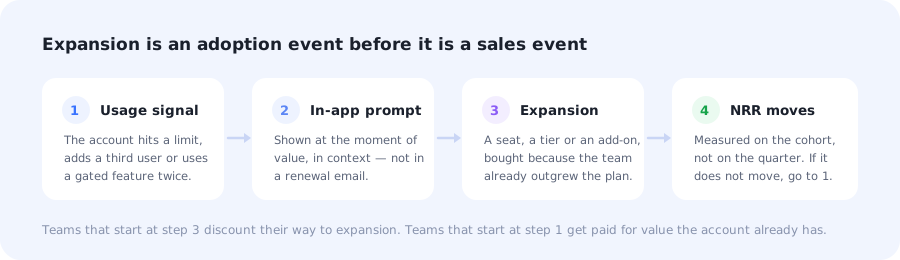
Expansion that starts from a usage signal costs nothing to generate. Expansion that starts at the renewal call usually costs a discount.
Fix the first 90 days, because that is where NRR is decided
Widen adoption inside the account, not just the champion
Make the next tier discoverable before the renewal call
Watch usage decline as an early contraction signal
Re-onboard accounts when their people change
1. Fix the first 90 days, because that is where NRR is decided
Expansion twelve months out is largely determined in the first three months. An account that never got a second workflow running has no reason to add seats, and every reason to review the line item at renewal. This makes NRR far more of a customer onboarding problem than a customer-success-coverage problem.
Concretely: shorten time to value for the first user, then define a second milestone beyond it, the workflow that turns a trial of one feature into a dependency. An onboarding checklist that ends at "you completed setup" produces accounts that renew flat. One that ends at "your team is running this weekly" produces accounts that expand.
2. Widen adoption inside the account, not just the champion
Seat expansion is downstream of team adoption, and single-champion accounts are the ones that vanish when that person changes job. The metric to watch per account is not logins; it is how many distinct people completed a meaningful action last month, and whether that number is going up.
The practical lever is making invited users successful without the champion having to train them. New users arriving in an existing workspace need their own first run: a short contextual tour of the workspace as configured, not the generic new-account flow. Getting that right is what turns three seats into eight.
3. Make the next tier discoverable before the renewal call
Most upgrade conversations fail because the customer has never seen what they would be buying. Features locked behind a higher plan are usually invisible: not in the navigation, not in the docs the team reads, never mentioned until a rep brings them up in a call where the buyer is already in cost-cutting mode.
The fix is ordinary feature discovery applied to gated capability: showing the feature in context, at the moment it would have helped, to the accounts whose usage says they need it. Done well this is in-app upsell; done badly it is a banner everyone learns to ignore. The difference is entirely in the targeting: a prompt triggered by hitting a limit converts, a prompt shown to everyone trains blindness.
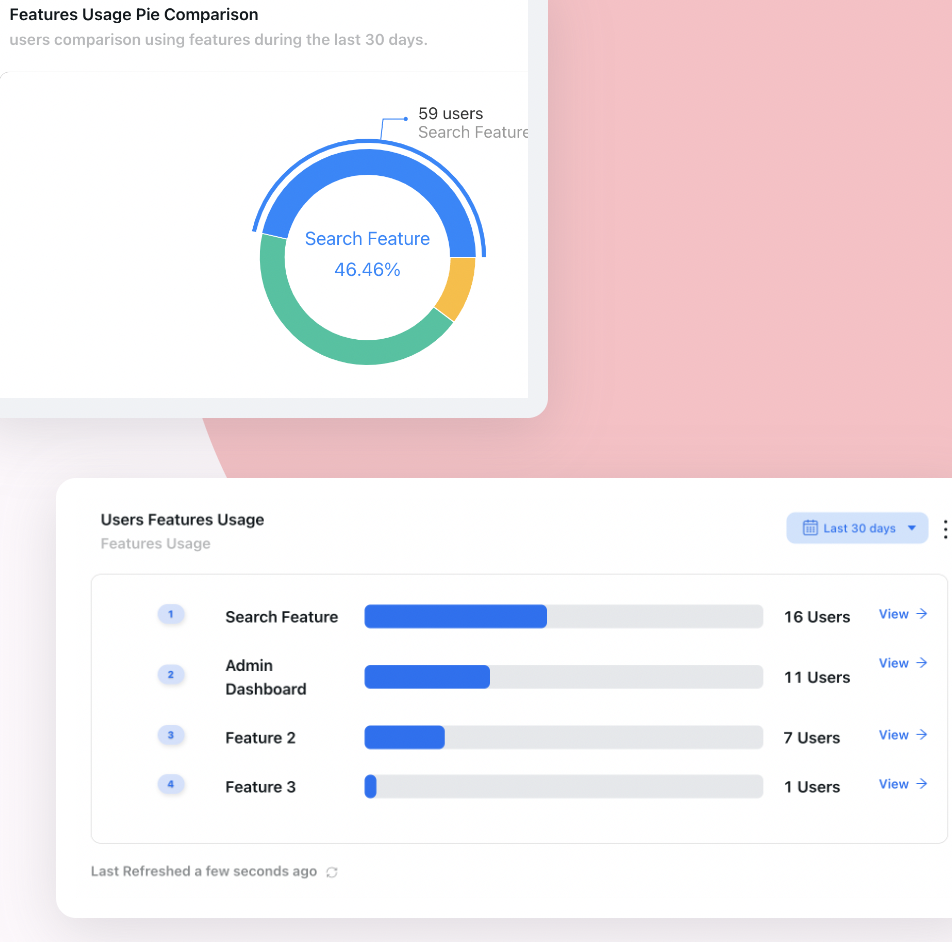
Breadth of feature use is the leading indicator of expansion: accounts that use four features rarely downgrade to a plan that allows two.
4. Watch usage decline as an early contraction signal
Contraction is rarely a surprise to the data and almost always a surprise to the account manager. Seats that stopped logging in, a core workflow that dropped out of the weekly rhythm, an admin who never replaced a departed colleague: each shows up months before the downgrade request.
A customer health score built on real usage rather than survey sentiment is what turns those signals into a work queue. The intervention does not have to be a call: often the right response is re-showing a feature the team stopped using, or an in-app nudge to the specific admin who can re-add the missing seats.
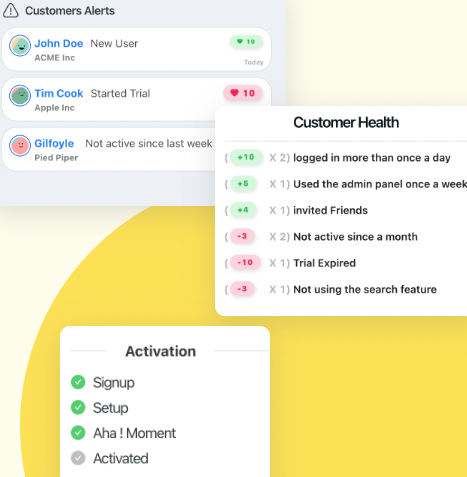
Scoring accounts on what they actually do, and alerting on the accounts that went quiet, turns contraction from a renewal surprise into a work queue.
5. Re-onboard accounts when their people change
Every account eventually loses the person who set it up. If nobody re-learns the product, usage decays quietly and the renewal becomes a debate about a tool nobody remembers choosing. Treat a new admin or a burst of new users on a mature account as an onboarding event, not a support event: the same guided first run you give a brand-new customer, targeted at that account only.
This is also where product adoption work pays off twice: it protects the base you have and makes the accounts you keep more likely to grow.
Reading NRR without fooling yourself
✅ Do
- Fix the cohort on day one and never edit it
- Publish GRR and logo retention beside it
- Break NRR down by plan, segment and cohort
- Check the median account, not just the total
- Track price increases as their own line
- Keep the period fixed so trends compare
- Read it next to real product usage
- Compare expanders against flat accounts
❌ Don't
- Let new customers into either side of the formula
- Drop churned accounts from the starting cohort
- Annualise a monthly NRR by multiplying
- Quote one aggregate number for the whole company
- Let one whale account carry the metric
- Compare your SMB product to enterprise benchmarks
- Discount your way to expansion at renewal
- Treat a revenue metric as proof of adoption
Moving NRR with Kompassify
Every lever above is an in-product intervention: get more people in the account successful, show the right capability at the right moment, and react to usage decline before renewal. Kompassify is a no-code digital adoption platform built for exactly that work, so product and customer success teams can ship these changes without engineering time.
- Onboard the second, third and tenth user with tours and tooltips scoped to accounts that already have a workspace configured.
- Target by usage, not by list: trigger a guide only for accounts approaching a plan limit or using a gated feature.
- Drive adoption of expansion-relevant features with contextual guidance instead of a generic upgrade banner.
- Re-onboard mature accounts when new admins arrive, using a checklist built for their configuration.
- Watch what actually gets used in product analytics, so contraction shows up as a usage trend rather than a renewal surprise.
- Announce genuinely relevant changes through the announcement widget, keeping the accounts that expanded aware of what they now have.
Kompassify is free up to 100 monthly active users, with paid plans from $129/month and GDPR-compliant EU hosting. If you are also scoring accounts for expansion readiness, the product qualified leads playbook pairs directly with the signals described here.
Make your existing customers your growth engine
Guide more users inside each account to real value, surface the next step at the moment it matters, and turn adoption into expansion, without writing code.
Start for Free →Frequently Asked Questions
What is net revenue retention (NRR)?
Net revenue retention is the percentage of recurring revenue you keep from an existing group of customers over a period, after expansion, contraction and churn, and excluding any revenue from new customers. An NRR of 112% means that cohort is paying 12% more than it did a year ago even though some accounts downgraded or left. It is the single clearest measure of whether your installed base grows on its own.
What is the NRR formula?
NRR = (Starting recurring revenue + expansion − contraction − churn) ÷ Starting recurring revenue × 100. Take the cohort's revenue at the start of the period, add upgrades, extra seats and add-ons, subtract downgrades and cancellations, then divide by the starting figure. New customers acquired during the period are never included in either the numerator or the denominator.
What is a good net revenue retention rate?
It depends on who you sell to. Commonly cited ranges are roughly 85–100% for SMB-focused products, 100–110% for mid-market, and 110–125% for enterprise software with seat and usage expansion. Anything above 100% means the base grows without new logos. Anything below 100% means acquisition has to fill the gap before it can fund growth. Compare against products with your contract shape and buyer size, not against a headline number from a different segment.
What is the difference between NRR and NDR?
None in practice. Net dollar retention (NDR) and net revenue retention (NRR) are the same metric under two names, with NDR more common in US reporting and NRR more common elsewhere. What does differ between companies is the definition behind the name: monthly versus annual periods, ARR versus MRR, and whether one-off fees are included. Always check the definition rather than the acronym.
What is the difference between NRR and GRR?
Gross revenue retention counts only what you lost: churn and downgrades. It ignores expansion, so it can never exceed 100%. Net revenue retention adds expansion back in, so it can. Read them together: an NRR of 115% sitting on a GRR of 78% means a handful of expanding accounts are masking a serious leak, and that pattern breaks the moment those accounts stop growing.
How do you improve net revenue retention?
Treat expansion as an adoption outcome rather than a sales activity. Widen the number of people inside each account who actually use the product, because seat expansion follows team adoption. Drive discovery of the features that sit at the edge of the current plan, so upgrades happen when the account has already outgrown its tier. Catch contraction early by watching usage decline instead of waiting for the renewal call. And fix the first ninety days, since accounts that never reached a second successful workflow rarely expand later.
Can NRR be above 100% while the business is shrinking?
Yes. NRR describes one cohort of existing customers, not the whole company. If new-customer acquisition has stalled or logo churn is high, total revenue can fall while the surviving cohort still expands. It is also flattered by survivorship: accounts that left mid-period are sometimes quietly dropped from the calculation. Always publish NRR next to gross revenue retention, logo retention and net new revenue.
Should NRR be measured monthly or annually?
Annual is the standard for reporting because it absorbs seasonality and matches renewal cycles, and it is the version investors expect. Monthly NRR is useful internally as an early-warning signal, particularly for products sold on monthly plans, but it is noisy and should never be annualised by multiplication. Whichever you use, keep the period fixed so the trend stays comparable.