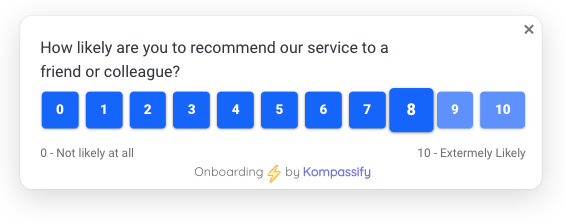
One question. A score from -100 to +100. And somehow, Net Promoter Score has become the most widely used loyalty metric in SaaS, quoted in board decks, tied to team bonuses, and printed on landing pages.
The idea is disarmingly simple. You ask users how likely they are to recommend your product to a friend or colleague, on a scale from 0 to 10. People who love you answer 9 or 10. People who are lukewarm answer 7 or 8. Everyone else, from mildly disappointed to actively furious, lands between 0 and 6. Subtract the unhappy from the enthusiastic, and you have your score.
The metric was introduced by Fred Reichheld of Bain & Company in a 2003 Harvard Business Review article that positioned it as the one number a company needs to grow. Two decades later, it is everywhere, and so is the biggest mistake teams make with it: most collect the score and do nothing with it. That is how a useful signal becomes a vanity metric.
This guide covers the whole picture: what NPS is, how the scale works, how to calculate it (with worked examples), what counts as a good score in SaaS, when and how to survey your users, and, most importantly, what actually moves the number.
Key Takeaways
- NPS measures loyalty, not satisfaction. It is based on one question, how likely are you to recommend us?, answered on a 0–10 scale. Recommending a product puts the user's own reputation on the line, which is why the question predicts behaviour better than "are you satisfied?"
- The formula is % Promoters − % Detractors. Promoters answer 9–10, detractors answer 0–6, and passives (7–8) count in the total but are not subtracted. The score ranges from -100 to +100.
- The average SaaS NPS is around 30–35. Below 0 is critical, 20–40 is average, 40–60 is strong, and above 60 is exceptional. But your trend over time matters far more than any benchmark.
- Where you ask changes what you learn. In-app NPS surveys get dramatically higher response rates than email, and the answers are better because the experience is still fresh.
- The score is an output. You do not improve NPS by optimising the survey. You improve it by fixing what detractors report, shortening time to value, and helping users discover the features they are missing.
- Closing the loop is the highest-ROI step. Reach out to every detractor within 48 hours. A customer who tells you they are unhappy is giving you a chance to fix it before they churn. The ones who say nothing just leave.
What Is Net Promoter Score (NPS)?
Net Promoter Score (NPS) is a customer loyalty metric based on a single survey question: "How likely are you to recommend [product] to a friend or colleague?" Respondents answer on a scale from 0 (not at all likely) to 10 (extremely likely), and the score is calculated from the distribution of those answers.
The question is deliberately about recommendation rather than satisfaction. A user can be satisfied and still switch to a competitor next quarter. But recommending a product to a colleague puts the user's own credibility at stake, and people do not risk that for software they merely tolerate. That is what makes NPS a loyalty metric: it captures whether users believe in your product enough to attach their name to it.
In SaaS, NPS sits alongside metrics like retention and churn rate as a health indicator for the customer relationship. The difference is timing: churn tells you a relationship has already ended, while NPS gives you a reading while there is still time to act on it.
NPS ≠ a satisfaction survey. Satisfaction (CSAT) asks about a specific, recent experience. NPS asks about the whole relationship. A user can rate your support interaction 5/5 today and still answer the recommendation question with a 4 because the product is missing the one feature their workflow depends on. You need both signals, and they answer different questions.
Why one number caught on
Before NPS, customer research meant long questionnaires with response rates to match. Reichheld's insight was that a single question, one that anyone can answer in five seconds, produces a metric a whole company can rally around. It is comparable across products, trackable over time, and simple enough that everyone from support to the board understands what a falling score means.
That simplicity is also its weakness. One number cannot tell you why users feel the way they do, which is why the follow-up question and the process around the score matter more than the score itself. More on that below.
The NPS Scale: Promoters, Passives, and Detractors
Every respondent falls into one of three categories based on their 0–10 answer. The categories are not arbitrary: they reflect how people actually behave after giving each score.
The NPS scale: respondents scoring 9–10 are promoters, 7–8 are passives, and everyone from 0 to 6 counts as a detractor.
| Score | Category | What It Means | What To Do |
|---|---|---|---|
| 9–10 | Promoters | Loyal enthusiasts who will keep buying, renew, and refer others. Your organic growth engine | Make advocacy easy: ask for reviews, referrals, and case studies while enthusiasm is high |
| 7–8 | Passives | Satisfied but unenthusiastic. They are not spreading negative word of mouth, but they are vulnerable to competitive offers | Find the one thing keeping them from a 9. Passives are usually the cheapest group to convert |
| 0–6 | Detractors | Unhappy customers who can damage your brand through negative word of mouth, and are likely to churn | Close the loop personally within 48 hours. Ask what happened, fix it, and follow up |
The strictness of the buckets surprises people the first time. A 6 out of 10 feels like a passing grade, but in NPS it counts as a detractor. That is intentional. Research behind the framework showed that only the most enthusiastic scores predict actual referral behaviour, so the bar for "promoter" is set deliberately high. Grade inflation is baked into how people answer surveys; the scale corrects for it.
Passives count more than the formula suggests. Passives are not subtracted in the calculation, but they are part of the total, which means they dilute your promoter percentage. Moving a passive to a promoter raises your NPS exactly as much as moving a detractor to a passive, and it is usually easier. If your responses show a large passive group, that is your fastest path to a higher score.
How to Calculate NPS: Formula and Examples
The calculation takes three steps: group your responses into promoters, passives, and detractors; work out what percentage of total responses each group represents; then subtract.
Passives (7–8) are not subtracted, but they count in the total number of respondents. The result ranges from −100 to +100.
Formula: NPS = % Promoters − % Detractors. For example, if 200 users respond and 120 are promoters (60%), 50 are passives (25%), and 30 are detractors (15%), your NPS is 60 − 15 = 45.
Note that the result is written as a whole number, not a percentage: an NPS of 45, not 45%. And because both percentages are calculated over all respondents, passives included, the score can range from -100 (every respondent is a detractor) to +100 (every respondent is a promoter).
Here is how different response distributions translate into scores:
| Promoters | Passives | Detractors | NPS | Reading |
|---|---|---|---|---|
| 70% | 20% | 10% | +60 | Exceptional: strong advocacy, word of mouth is working for you |
| 50% | 30% | 20% | +30 | Around the SaaS average: healthy, with a large passive group to convert |
| 35% | 30% | 35% | 0 | Break-even: every promoter is cancelled out by a detractor |
| 20% | 25% | 55% | −35 | Critical: negative word of mouth is outpacing advocacy, expect churn |
Watch your sample size. With 20 responses, a single user switching category moves your score by 5 points, which means small-sample NPS mostly measures noise. Treat your score as directional until you have at least a few hundred responses per period, and never compare two months with wildly different response counts as if they were equivalent.
What Is a Good NPS? (SaaS Benchmarks 2026)
Benchmarks are useful as a sanity check, not as a target. NPS varies significantly by industry, by customer segment, and even by how and where the survey is delivered. That said, for SaaS specifically, the bands below are a reliable way to read your score.
| NPS Range | Verdict | What It Tells You |
|---|---|---|
| Below 0 | Critical | More detractors than promoters: a serious customer satisfaction problem. Fix the product experience before spending another euro on acquisition |
| 0–20 | Below average | Below average for SaaS. Meaningful improvement needed, start by reading detractor feedback |
| 20–40 | Average | Most SaaS companies sit in this range. Solid, with clear room to grow through the passive group |
| 40–60 | Strong | Genuine customer advocacy. Promoters are actively fuelling organic growth |
| Above 60 | Exceptional | The territory of category-defining products, rare and hard to sustain |
Industry benchmarks put the average SaaS NPS at around 30–35. But chasing someone else's number is the wrong game. Survey methodology alone, in-app versus email, who you ask, when you ask, can swing a score by double digits, which makes cross-company comparisons shakier than they look.
The comparison that actually matters is you versus you, last quarter. Track the trend, segment it, and correlate movements with what you shipped. A score that climbs from 18 to 31 over two quarters tells you your onboarding rework landed. A benchmark table cannot tell you that.
Relational vs. Transactional NPS
There are two ways to run NPS, and mature SaaS teams run both, because they answer different questions.
| Relational NPS | Transactional NPS (tNPS) | |
|---|---|---|
| What it measures | Loyalty to the overall relationship | The impact of one specific experience |
| When it's asked | On a schedule: quarterly or twice a year | Right after an event: onboarding completed, support ticket closed, new feature used |
| Example trigger | 90 days after sign-up, then every quarter | The moment a user finishes your onboarding checklist |
| Best for | Board-level trend, cohort health, churn early-warning | Diagnosing which touchpoints create promoters or detractors |
| Failure mode | Too infrequent to explain why the score moved | Measures the moment, not the relationship: a great onboarding tNPS can coexist with terrible long-term loyalty |
A practical setup for most SaaS teams: a relational survey once per quarter per user, plus transactional surveys after the two or three moments that define the customer experience, the end of onboarding, the first use of a flagship feature, and support resolutions. The relational score gives you the headline; the transactional scores tell you which part of the journey is dragging it up or down.
How to Run an NPS Survey That Users Actually Answer
The mechanics of the survey shape both your response rate and the honesty of what you hear. These are the practices that separate a signal from a shrug.
1. Ask in-app, at the right moment
The best time to ask users how they feel is while they are using your product, not three days later in an inbox they may never open. An in-app survey catches users in context, so response rates are dramatically higher than email, and the feedback is better because the experience is still fresh. With Kompassify's NPS surveys, the prompt appears as a small, dismissible widget inside your app, and you control exactly who sees it, where, and when, without writing code.
2. Wait until the user has experienced value
An NPS prompt on day one measures your sign-up form, not your product. Wait until the user has reached activation, the moment they have experienced what your product actually does, before asking whether they would recommend it. For most SaaS products that means surveying no earlier than a few weeks in, once usage has settled into a pattern worth having an opinion about.
3. Always ask the follow-up question
The score tells you that something is right or wrong. The open-text follow-up, "What's the main reason for your score?", tells you what. This is where the real product insights live. Aggregate the responses by category: what detractors mention is your fix list, what promoters mention is your marketing copy. A score without verbatims is a thermometer without a diagnosis.
4. Keep it to two steps
One score, one open question, done. Every additional field costs you responses, and a survey that feels like a form stops being answered at all. If you need demographic or plan data, you already have it in your user properties, do not ask users for what your system already knows.
5. Segment before you interpret
A blended NPS of 32 might hide a score of 55 among customers on annual plans and 8 among last month's cohort, two very different stories with two very different action plans. Segment responses by plan, role, lifecycle stage, and cohort. Targeting matters on the way out too: Kompassify's survey targeting lets you survey a specific segment, new users after onboarding, say, or long-time admins, instead of blasting everyone at once.
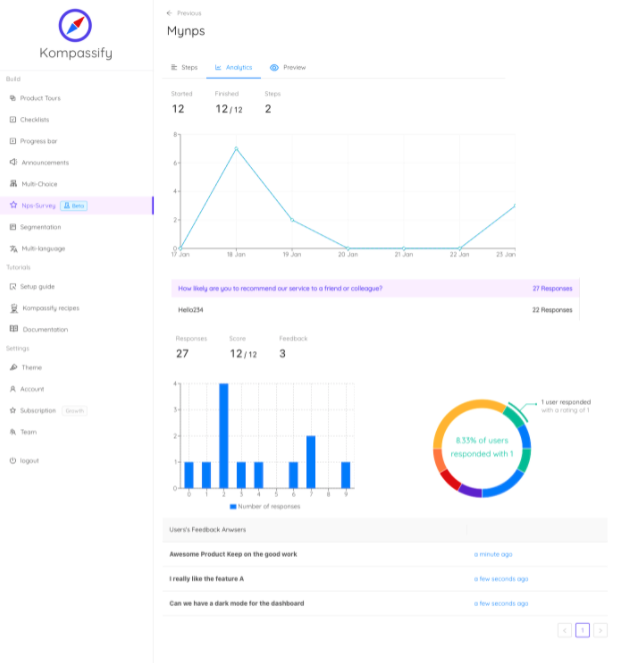
Kompassify's NPS analytics: score, response distribution over time, and every open-text answer in one view.
6. Don't over-survey
Once per quarter per user is the ceiling for relational NPS. Survey more often and users start dismissing the prompt on sight, which quietly biases your results toward the people with strong opinions. Spread surveys across the user base on a rolling schedule rather than surveying everyone the same week, and you get a continuous reading instead of a quarterly spike.
7. Close the loop within 48 hours
This is the highest-ROI step in the entire process. Reach out personally to every detractor within 48 hours: ask what happened, fix what you can, and follow up when you have. A customer who tells you they are unhappy is giving you a chance to save the relationship, the ones who say nothing just churn. And close the loop with promoters too: a timely ask for a review, a referral, or a case study converts enthusiasm into pipeline while it is still warm.
How to Improve Your NPS (What Actually Moves the Score)
Here is the part most NPS guides get wrong: you do not improve NPS by working on the survey. The score is an output. It moves when the experience behind it moves, and in SaaS, a handful of levers do most of the work.
Fix what detractors keep repeating
Aggregate your open-text feedback and look for systemic issues, not individual complaints. If eleven detractors mention the same confusing workflow, that workflow is your roadmap item. This sounds obvious, and almost nobody does it consistently: feedback gets read once, nodded at, and archived. Put the top three detractor themes in front of your product team every month and watch what happens to the score two quarters later.
Shorten the path to value
Users who never reach their Aha moment do not become promoters, they become detractors or, worse, silent churn. The single most reliable NPS lever in SaaS is onboarding: a guided first session with a product tour, a short onboarding checklist, and contextual help at the moment of confusion. Research by Bain & Company shows that increasing customer retention by just 5% can boost profits by 25% to 95%, and the road to retention runs directly through those first sessions.
Help users discover what they're missing
A surprising share of lukewarm scores come from users who would love a feature you already shipped, they just never found it. Passives especially are often one discovery away from a 9. Use feature announcements and targeted product tours to surface the capabilities each segment is not using yet.
Tell users what you changed
Acting on feedback silently wastes half its value. When you fix something detractors reported, say so, an in-app announcement along the lines of "You told us the export flow was confusing. We rebuilt it." does two things at once: it improves the experience and it proves that answering your surveys is worth the user's time. Response rates and scores both benefit.
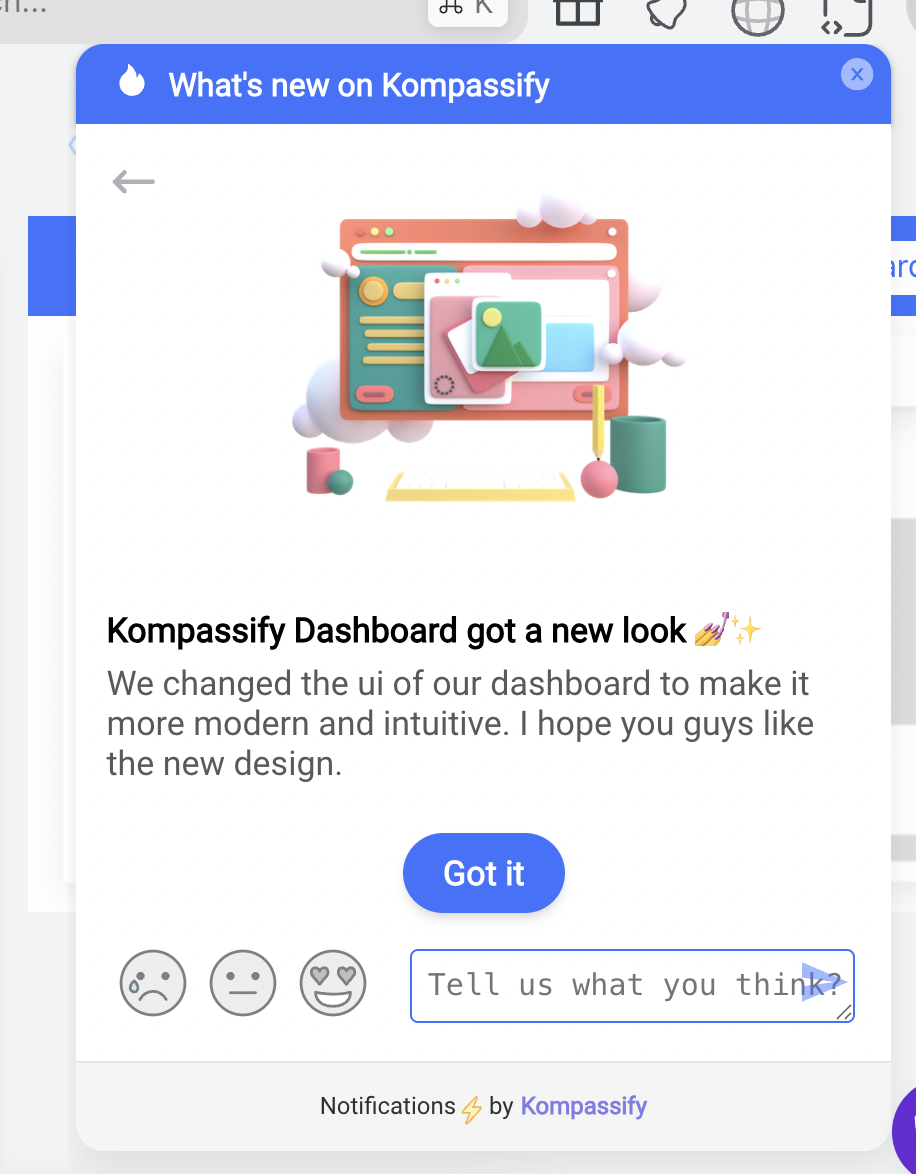
Closing the loop in-app: a Kompassify announcement paired with emoji reactions and a free-text feedback prompt.
Turn promoters into a channel
Promoters have already told you they are willing to recommend you. Make it effortless: prompt for a G2 review right after a 9–10 response, invite them to a referral program, ask for a case study. This does not raise the score itself, but it converts the score into the growth it was always meant to predict.
Do not game the score. Begging for 10s ("anything less than a 9 means we failed!"), surveying only your happiest segment, or dangling incentives for high scores will inflate the number and destroy the signal. A gamed NPS is worse than no NPS: you lose the early warning it exists to provide, and the underlying retention problems keep compounding out of sight.
The Limitations of NPS
NPS is a useful proxy, not a complete picture. Take it seriously, but know what it cannot do.
- It is a lag measure. The score reflects past experience. By the time detractor feedback reaches your dashboard, the damage that caused it has already been done, which is why pairing NPS with leading indicators like activation and engagement matters.
- It does not tell you why. The number alone is unactionable. Without the open-text follow-up and a process for reading it, NPS is decoration.
- Small samples lie. A handful of responses can swing the score wildly. Treat low-volume scores as anecdotes, not metrics.
- Culture skews scores. Response styles differ across countries: some markets rarely give 9s or 10s regardless of enthusiasm. If your user base is international, compare segments against themselves, not each other.
- It is easy to game. Tie bonuses to NPS and you will get a better NPS, and worse information. Keep the metric diagnostic, not political.
None of this makes NPS worthless. It makes it one instrument on the dashboard, best read alongside retention, activation, and product usage data rather than in place of them.
NPS: Do vs. Don't
A quick reference for what to aim for and what to avoid.
✅ Do
- Survey in-app, in context, after the user has experienced value
- Always ask the open-text follow-up question
- Close the loop with detractors within 48 hours
- Segment scores by plan, cohort, role, and lifecycle stage
- Track your own trend quarter over quarter
- Run relational and transactional NPS together
- Share detractor themes with the product team monthly
- Announce the fixes that came from feedback
- Ask promoters for reviews and referrals while enthusiasm is high
❌ Don't
- Survey users on day one, before they have seen any value
- Rely on email-only surveys and accept single-digit response rates
- Beg for 9s and 10s or incentivise high scores
- Obsess over competitor benchmarks with different methodologies
- Survey the same user more than once a quarter
- Read the score and ignore the verbatims
- Treat passives as fine, they are your most convertible group
- Collect feedback and never visibly act on it
- Use NPS as your only measure of customer health
NPS vs. CSAT vs. CES: Which Should You Use?
NPS is one of three standard feedback metrics, and the three are complements, not competitors. Each answers a different question about a different scope.
| NPS | CSAT | CES | |
|---|---|---|---|
| The question | How likely are you to recommend us? | How satisfied were you with this experience? | How easy was it to get this done? |
| Scale | 0–10 | Usually 1–5 | Usually 1–7 |
| What it measures | Loyalty to the overall relationship | Satisfaction with a specific interaction | Friction in a specific task |
| Best for | Long-term health, churn early-warning, board reporting | Evaluating touchpoints: onboarding, support, a new feature | Finding and fixing effort hotspots in workflows |
| Cadence | Quarterly (relational) or event-based (tNPS) | Right after the interaction | Right after the task |
A sensible starting stack for a SaaS team: relational NPS as your headline loyalty metric, CSAT after onboarding and support interactions, and CES on the one or two workflows where you suspect friction. With Kompassify you can run NPS, CSAT, and custom surveys from the same no-code builder, so adding a second metric is a configuration change, not a project.
Ready to Measure (and Improve) Your NPS?
Kompassify gives you no-code NPS, CSAT, and custom surveys that run inside your product, plus the product tours, onboarding checklists, and announcement widgets you need to act on what users tell you. GDPR compliant, EU-hosted, and free for under 100 monthly active users.
Start for Free →Frequently Asked Questions
What is Net Promoter Score (NPS)?
Net Promoter Score is a customer loyalty metric based on a single survey question: how likely are you to recommend this product to a friend or colleague? Respondents answer on a 0–10 scale and are grouped into promoters (9–10), passives (7–8), and detractors (0–6). The score is the percentage of promoters minus the percentage of detractors, giving a number between -100 and +100. It was introduced by Fred Reichheld of Bain & Company in a 2003 Harvard Business Review article and has become the most widely used loyalty metric in SaaS.
How do you calculate NPS?
NPS = % Promoters − % Detractors. Count the percentage of respondents who answered 9 or 10, subtract the percentage who answered 0 to 6. Passives (7–8) are not subtracted, but they count in the total number of respondents. Example: 200 responses with 120 promoters (60%), 50 passives (25%), and 30 detractors (15%) gives an NPS of 60 − 15 = 45.
What is a good NPS for SaaS?
The average SaaS NPS is around 30–35. Below 0 is critical, 0–20 is below average, 20–40 is average, 40–60 is strong, and above 60 is exceptional. That said, methodology differences make cross-company comparisons unreliable, the most useful benchmark is your own score last quarter.
Can an NPS score be negative?
Yes. NPS ranges from -100 (every respondent is a detractor) to +100 (every respondent is a promoter). A negative score means detractors outnumber promoters, a serious signal that negative word of mouth is outpacing advocacy. If your NPS is negative, close the loop with detractors and fix what they report before investing further in acquisition.
How often should you send NPS surveys?
For relational NPS, once per quarter per user is the ceiling, twice a year works for products with less frequent usage. Over-surveying trains users to dismiss your prompts and biases the results. Transactional NPS is triggered by events instead, such as completing onboarding or closing a support ticket, so its frequency follows the events themselves.
What is the difference between NPS, CSAT, and CES?
NPS measures loyalty to the overall relationship (how likely are you to recommend us, 0–10). CSAT measures satisfaction with a specific interaction (how satisfied were you, usually 1–5). CES measures effort (how easy was it to complete this task). Use NPS for the long-term trend, CSAT for evaluating touchpoints like onboarding and support, and CES for finding friction in specific workflows.
What tools can you use to run NPS surveys?
Kompassify lets you run NPS surveys directly inside your product without writing code: install a single JavaScript snippet, then build, target, and schedule surveys from the dashboard. Because surveys appear in-app at the right moment, response rates are dramatically higher than email. You also get CSAT and custom surveys, segmentation to target the right users, and the onboarding tools, product tours, checklists, and announcement widgets, to act on the feedback. There is a free plan for under 100 monthly active users.