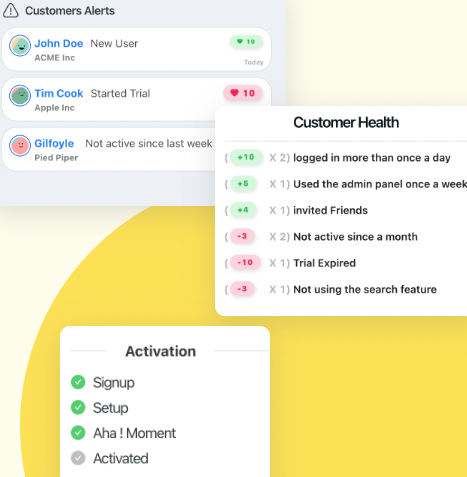
No SaaS metric is easier to ignore than churn. Sign-ups are exciting. Revenue is visible. But churn works in the background, one quiet cancellation at a time, and because it compounds, a leak that looks harmless month to month can remove half your customer base in a year.
User churn is the rate at which users stop using your product. It is the opposite of retention, the denominator of every growth plan, and, for most products, the single cheapest place to find growth. Acquiring a new customer costs 5 to 25 times more than retaining an existing one (Harvard Business Review), and research by Bain & Company shows that increasing retention by just 5% can boost profits by 25% to 95%. Every point of churn you eliminate is acquisition budget you no longer have to spend.
This guide covers the full picture: what churn means and the types of churn (customer vs revenue, gross vs net, voluntary vs involuntary), the churn rate formula with a worked example, how monthly churn compounds into annual churn, what a good churn rate looks like in SaaS, why users actually leave, and the onboarding and engagement playbook that reduces it.
Key Takeaways
- User churn is the rate at which users stop using your product. In SaaS it usually means cancelled subscriptions, but behaviorally it starts earlier, when a user stops showing up.
- The formula is simple: users lost in a period ÷ users at the start of it × 100. The discipline is in measuring it per cohort and per segment, not as one blended number.
- Churn compounds brutally. A "small" 5% monthly churn removes 46% of your customer base in a year. Small monthly improvements have outsized annual impact.
- Customer churn and revenue churn tell different stories. Track both: one grades the product, the other grades the business.
- Not all churn is a decision. Involuntary churn (failed payments, expired cards) is recovered with billing fixes, not product fixes.
- Most churn is decided in the first days. Users who never reach the aha moment quietly become next quarter's cancellations, which is why the highest-leverage churn fixes live in onboarding and activation.
What Is User Churn? (Definition & Meaning)
User churn (you will also see it called customer churn, logo churn, or customer attrition) is the rate at which users stop using your product over a given period. In subscription businesses, a churned user is usually one who cancels or fails to renew. For product teams, the more useful definition starts earlier: a user has effectively churned the day they stop coming back, even if the subscription limps on for another billing cycle.
Churn and retention are two views of the same number: a product with 3% monthly churn retains 97% of its users each month. But the framing matters. Retention asks "who is still here?"; churn asks "who did we lose, and why?", and it is the churn framing that turns a dashboard number into a to-do list.
Churn, defined. User churn is the percentage of users or customers who stop using your product during a given period, measured against the number you started the period with. If 2,000 customers start the month and 60 cancel, monthly churn is 3%. The same idea applies one level deeper as revenue churn, the percentage of recurring revenue lost, and the two can move in opposite directions.
The most intuitive way to picture churn is the leaky bucket. Acquisition pours new users in at the top; churn leaks them out of the bottom. If the leak is faster than the pour, the bucket never fills; no acquisition budget can outrun it. Fixing the leak is what makes every other growth effort compound instead of evaporate.
The leaky bucket: acquisition pours users in, churn leaks them out. If the leak outpaces the pour, no acquisition budget can fill the bucket.
Why churn is the metric investors read first
Because it sets the ceiling on everything else. Churn determines customer lifetime value, which determines what you can afford to spend on acquisition, which determines how fast you can grow. Two SaaS products with identical sign-up numbers and different churn rates are two different businesses: one compounds, the other reruns the same quarter forever. High churn also poisons the metrics around it: it drags down product adoption, inflates customer acquisition cost payback, and hides real growth under replacement growth.
Churn Rate: The Formula and How to Calculate It
The churn rate formula divides the users you lost in a period by the users you had when the period started:
Exclude users who signed up during the period; count only losses from the starting base.
A worked example: you start June with 2,000 customers. During the month, 60 cancel and 300 new customers sign up. Your June churn rate is 60 ÷ 2,000 = 3%. The 300 new sign-ups don't enter the calculation: they belong to their own cohort, and mixing them in is the classic way fast-growing companies convince themselves they don't have a churn problem.
The measurement decisions that make or break the number
- Pick a period and stick to it. Monthly is the SaaS standard; annual suits enterprise products with yearly contracts. Never compare a monthly figure against someone's annual one.
- Define the churn event. Cancellation is clean but late. Pairing it with a behavioral definition, no core action in 30 days, lets you see churn while there is still time to act on it.
- Cohort it. A single blended churn number mixes last month's sign-ups with five-year-old accounts and hides both improvement and decay. Measure churn per sign-up cohort, exactly as you would build a retention curve.
- Segment it. Churn by plan, persona, acquisition channel, and company size. A 3% blended rate that splits into 1% enterprise and 9% self-serve is not one problem: it is two different products.
Why small churn numbers are lying to you
Churn compounds. Annual churn is not monthly churn times twelve: it is 1 − (1 − monthly churn)12, and the difference is brutal. A 2% monthly churn sounds tolerable; it means losing more than a fifth of your customers every year. At 5% monthly, nearly half your customer base is gone in twelve months:
How monthly churn compounds into annual churn: annual = 1 − (1 − monthly)¹². A "small" 5% monthly churn removes 46% of your customer base in a year.
Beware the growth mask. When sign-ups are strong, total active users can climb while churn quietly worsens, new cohorts papering over the losses from old ones. This is why churn must be measured against the starting base and per cohort. The month acquisition slows is the month a masked churn problem becomes visible, and by then it is a year old.
The Types of Churn: Customer, Revenue, Voluntary, Involuntary
"Churn" is one word covering three separate distinctions. Every churn conversation goes better when you name which one you mean.
Accounts lost. The product-health signal: every lost account is a user the product failed.
MRR lost. The business-health signal: maps directly to money, weights big accounts more.
Only the losses: cancellations and downgrades. Grades how leaky the bucket is.
Losses minus expansion revenue. Can go negative, the best growth state in SaaS.
A decision: not enough value, a competitor, a vanished need. Fixed in the product.
An accident: failed payment, expired card. Fixed in billing, not in the product.
Customer churn vs revenue churn
The two can tell opposite stories about the same month. Lose twenty $29 accounts while your $2,000 accounts stay: customer churn looks alarming, revenue churn barely moves. Lose one enterprise account: revenue churn spikes while customer churn rounds to zero. Neither number is "the right one": customer churn grades the product, revenue churn grades the business, and a healthy team reviews both side by side.
Negative churn: the state worth engineering toward
Negative churn (net negative revenue churn) happens when expansion revenue from existing customers (upgrades, added seats, add-ons) exceeds the revenue lost to cancellations and downgrades. At that point your existing customer base grows in value even with zero new sign-ups, which is the most capital-efficient growth state in SaaS. Note that it only exists for revenue: customer churn can never be negative, because a cohort can lose accounts but never gain them. The path to negative churn runs through the same territory as churn reduction: users only expand once they have genuinely adopted the product.
Voluntary vs involuntary churn
A surprising share of churn (for self-serve SaaS, often 20–40% of it) is involuntary: the card expired, the payment bounced, the invoice email went to a dead inbox. These users didn't decide to leave, which makes this the easiest churn you will ever recover: payment retries, card-expiry reminders, backup payment methods, and a grace period instead of an instant cutoff. Fix involuntary churn first (it is plumbing, not product strategy) and then your remaining churn number is a clean read on how much value the product delivers.
What Is a Good Churn Rate? (SaaS Benchmarks)
Benchmarks vary by audience, price point, and how churn is measured, but the broad bands for SaaS are consistent enough to be useful:
| Segment | Healthy | Excellent | Notes |
|---|---|---|---|
| B2B SaaS: customer churn | < 2% monthly | < 1% monthly | Annual churn below 10% is broadly considered sustainable |
| B2C SaaS: customer churn | 3–7% monthly | < 3% monthly | Higher tolerance: cheaper acquisition, less sticky relationships |
| SMB-focused: gross revenue churn | < 2% monthly | < 1% monthly | Small accounts churn more; volume smooths the number |
| Mid-market: gross revenue churn | < 1% monthly | < 0.5% monthly | Longer contracts and deeper integrations hold accounts |
| Enterprise: gross revenue churn | < 0.5% monthly | ≈ 0% + expansion | Best-in-class enterprise SaaS runs net negative churn |
Three cautions before comparing yourself to any table, this one included. First, check the measurement matches: customer vs revenue, gross vs net, monthly vs annual all produce different numbers from the same business. Second, early-stage products naturally churn more; benchmarks describe products past product-market fit. Third, the benchmark that actually drives decisions is your own history: churn falling cohort over cohort is success at any absolute level, and churn rising is a warning at any absolute level.
Why Users Churn: The Six Root Causes
Cancellation surveys record the last straw, not the story. By the time a user clicks cancel, the real cause is usually weeks or months old. These are the six causes that show up behind most SaaS churn:
-
They never reached first value
The largest single cause. Users sign up with intent, hit friction or an empty screen, and never experience the product working for them. Churn that shows up at month three was usually decided in week one; the user just hadn't gotten around to cancelling. This is an activation failure wearing a churn costume.
-
The habit never formed
They saw the value once, then usage faded: the product never attached itself to a recurring workflow. Fading logins, shrinking session depth, and lapsed core actions are the visible symptoms, and they are readable in your analytics months before the cancellation.
-
They don't know what they're paying for
Users stuck on ten percent of the product judge its price against ten percent of its value. Features shipped but never discovered do nothing for retention: feature discovery is churn prevention wearing a different name.
-
They were never the right user
Some churn is acquisition's fault: users pulled in by ads or trends whose problem the product doesn't solve. If one channel's cohorts churn at multiples of another's, the fix belongs in targeting and positioning, not in the product.
-
Silent dissatisfaction
Most unhappy users never complain; they just leave. Without an in-app feedback loop like NPS surveys, the first time you hear about a problem is the cancellation it caused.
-
The payment failed
Involuntary churn: expired cards, bounced payments, billing errors. No product improvement touches it; only dunning emails, payment retries, and grace periods do.
How to Reduce User Churn: A 6-Step Playbook
Churn reduction is not one initiative; it is a sequence, ordered by leverage. Start where the most churn is decided: the beginning of the user journey.
1. Measure it honestly, then segment the leak
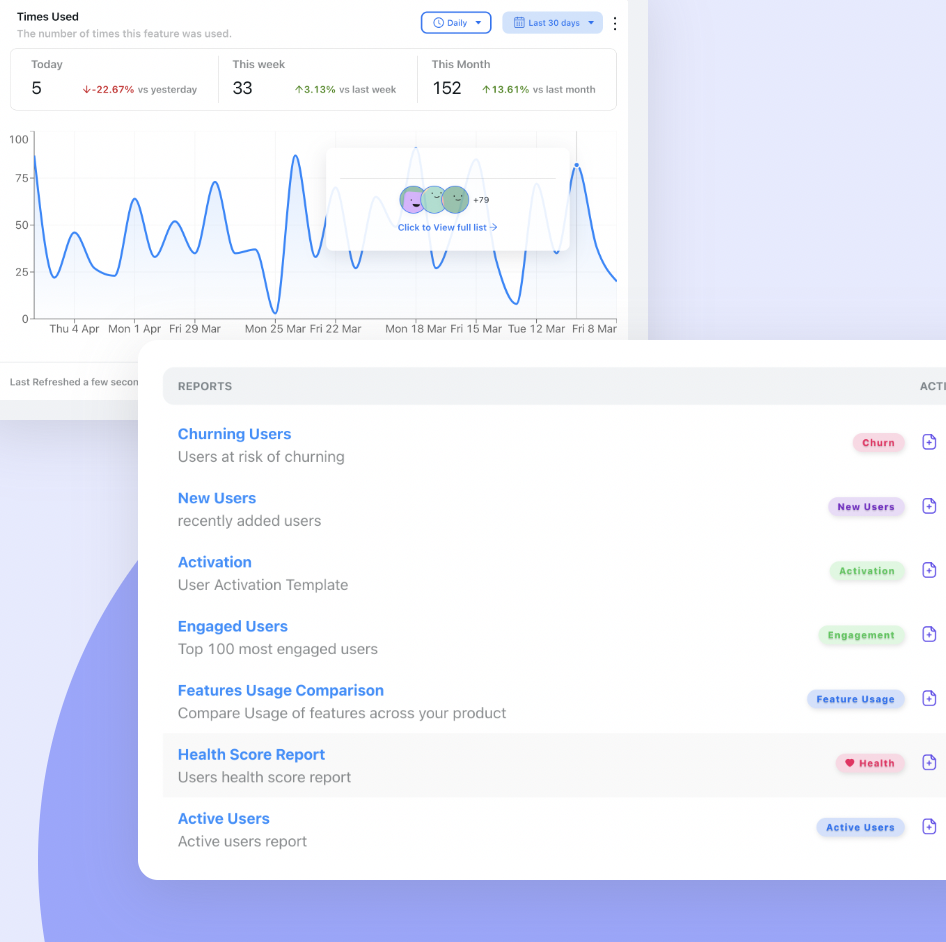
Before fixing anything, get the number right: churn per cohort, split by plan, channel, and persona, with voluntary and involuntary churn separated. This tells you which fix to ship first: a steep first-week drop-off calls for onboarding work, fading long-term usage calls for engagement work, and a fat involuntary slice calls for billing work. Kompassify's no-code product analytics reports churning, engaged, and activated users out of the box, so you can see who is slipping while there is still time to act.
2. Fix the first session
Nothing reduces churn like a first session that ends in a win. Replace the empty screen with a focused product tour that walks new users to one meaningful outcome, and back it with a 3–5 task onboarding checklist that carries momentum into the second and third session. Users who complete onboarding churn at a fraction of the rate of users who bounce off a blank dashboard.
3. Drive every user to the aha moment
Identify the action that separates your retained users from your churned ones, the aha moment, and rebuild your onboarding to reach it in the shortest possible path. This is the single highest-leverage churn intervention, because it converts would-be churners into habit-formers at the moment the decision is actually being made.
4. Keep shipping visible
Every improvement you ship is a retention argument, but only if users see it. Announce new features in-app with feature announcements and use contextual tooltips to surface capabilities users haven't touched. A user who keeps discovering value keeps finding reasons to stay; announcements are also the cheapest way to resurrect dormant users when they next visit.
5. Hear the unhappy users before they leave
Run NPS surveys in-app and treat every detractor response as a churn early-warning with a name attached. Read the verbatims, close the loop personally on the fixable ones, and feed the recurring themes into the roadmap. Passives and detractors rarely warn you twice.
6. Recover the churn that was never a decision
Close the involuntary leak: automatic payment retries, card-expiry reminders before the card dies, a backup payment method, and a grace period with an in-app nudge instead of a hard cutoff. This is the most mechanical work on the list and often the fastest single-digit improvement available: recovered payments are retained customers you didn't have to win back.
Churn vs Retention: Two Sides of One Coin
Churn and retention are mathematical complements (3% monthly churn is 97% monthly retention) but they drive different work, and mature teams use both framings deliberately.
| Churn | Retention | |
|---|---|---|
| The question | Who did we lose, and why? | Who stays, and what makes them stay? |
| Best instrument | Churn rate per cohort and segment, exit feedback | The retention curve: cliff, slope, and plateau |
| Drives | Leak-fixing: onboarding gaps, billing failures, at-risk saves | Value-building: habits, engagement loops, expansion |
| Failure mode | Firefighting cancellations one at a time | Celebrating a plateau while ignoring who fell off before it |
| Use it as | The alarm system | The strategy |
In practice the two playbooks converge, because the forces that reduce churn are the forces that build retention: fast activation, a reliable path to the aha moment, continuous feature discovery, and a feedback loop that catches problems early. Our guide to increasing user retention is the same battle described from the winning side.
Reducing Churn: Do vs. Don't
A quick reference for keeping your churn work honest and effective.
✅ Do
- Measure churn against the starting base, per cohort
- Separate voluntary from involuntary churn before diagnosing
- Track customer churn and revenue churn side by side
- Treat fading usage as churn in progress, not a curiosity
- Fix onboarding and activation first: that's where churn is decided
- Announce shipped value in-app so users keep discovering it
- Run NPS and read detractor verbatims as early warnings
- Recover failed payments with retries and expiry reminders
- Benchmark against your own earlier cohorts first
❌ Don't
- Let strong sign-ups mask a worsening churn rate
- Blend all users into one churn number and call it insight
- Compare your monthly churn to someone's annual benchmark
- Wait for the cancellation to consider a user churned
- Ship discounts as a churn fix; they defer it, expensively
- Guilt-trip users in the cancellation flow
- Treat involuntary churn as a product problem
- Survey churned users and change nothing
- Scale acquisition on top of an unfixed leak
Ready to Plug the Leak?
Kompassify combines the churn-reduction levers in one no-code platform: product tours, onboarding checklists, in-app announcements, NPS surveys, and product analytics that report churning, engaged, and activated users. GDPR compliant, EU-hosted, and free for under 100 monthly active users.
Start for Free →Frequently Asked Questions
What is user churn?
User churn (also called customer churn or attrition) is the rate at which users stop using your product over a given period. In SaaS it usually means a cancelled subscription, but for product teams it starts earlier, when a user stops coming back, long before they formally cancel. Churn is the opposite of retention: a product with 3% monthly churn retains 97% of its users each month. It matters because churn compounds: what looks like a small monthly leak quietly removes a large share of your customer base over a year.
How do you calculate churn rate?
Churn rate = (users lost during a period ÷ users at the start of that period) × 100. Example: you start the month with 2,000 customers and 60 of them cancel. Your monthly churn rate is 60 ÷ 2,000 = 3%. Exclude new users who joined during the period, otherwise fast growth will hide real churn. Measure it monthly for most SaaS products, and track it per cohort and per segment, not just as one blended number.
What is a good churn rate for SaaS?
For B2B SaaS, monthly customer churn below 2% is healthy and below 1% is excellent; annual churn below 10% is broadly considered sustainable. B2C products typically tolerate higher churn because acquisition costs are lower and relationships are less sticky. For revenue churn, gross monthly churn below 2% is strong for SMB-focused SaaS, below 1% for mid-market, and below 0.5% for enterprise. Because definitions and audiences vary, your most reliable benchmark is your own earlier cohorts.
What is the difference between customer churn and revenue churn?
Customer churn (user churn) counts the accounts you lose; revenue churn counts the money you lose. They can tell opposite stories: if you lose many small accounts but keep the large ones, customer churn looks bad while revenue churn looks fine, and vice versa. Track both: customer churn is the better product-health signal, revenue churn the better business-health signal.
What is negative churn?
Negative churn (net negative revenue churn) happens when expansion revenue from existing customers (upgrades, seat additions, add-ons) exceeds the revenue lost to cancellations and downgrades. Your existing customer base then grows in value even with zero new sign-ups, the most capital-efficient growth state in SaaS. It only applies to revenue churn: customer churn can never be negative, because a cohort can lose accounts but not gain them.
What is the difference between voluntary and involuntary churn?
Voluntary churn is a deliberate decision to leave: not enough value, a competitor won, the need went away. Involuntary churn is unintentional: a failed payment, an expired card, or a billing error ends the subscription without the user choosing to leave. The fixes are different: voluntary churn is fixed in the product (onboarding, activation, engagement) while involuntary churn is fixed with payment retries, card-expiry reminders, and grace periods.
How do you reduce user churn?
Most churn is decided early, so the highest-leverage fixes are at the start of the journey: shorten the path from sign-up to first value with a focused product tour and an onboarding checklist, drive users to the aha moment before they drift, keep shipping visible with in-app announcements, and run NPS surveys to catch dissatisfaction while it is fixable. Then use analytics to spot fading usage and re-engage at-risk users, and clean up involuntary churn with payment recovery. Kompassify combines these levers in one no-code platform, free for under 100 monthly active users.