
You are acquiring users. They sign up, poke around for a session or two, and then disappear. A week later your dashboard shows a spike in new sign-ups and a flat line in active users. The bucket is leaking faster than you can fill it.
This is the default state of most SaaS products. On average, software keeps just 39% of users after one month, and roughly 30% after three, according to 2025 SaaS benchmark data. That means for every 100 users you add today, fewer than a third will still be around in 90 days.
Meanwhile, acquiring a new customer costs 5 to 25 times more than retaining an existing one (Custify). If your retention is broken, no amount of acquisition budget will fix it. You are not solving a growth problem. You are filling a bucket with a hole in it.
The good news is that retention is a solvable problem and it starts with understanding exactly where users are dropping off and why.
Retention
Rate
Key Takeaways
- Retention is the real growth lever. Acquiring a new customer costs 5–25 times more than retaining an existing one. If your retention is broken, no amount of acquisition spend will fix it.
- User retention ≠ customer retention. User retention tracks who actively uses your product. Customer retention tracks who keeps paying. Declining user retention is the leading indicator that customer retention will follow.
- Most churn happens early. 60–70% of annual churn happens within the first 90 days (Paddle/ProfitWell, 2025). That makes onboarding the single highest-leverage moment in the user lifecycle.
- Measure retention in cohorts, not averages. Aggregate numbers hide whether your product is actually getting better over time. Cohort analysis shows you the truth.
- Retention compounds. A product with NRR above 100% grows from its existing base alone. Median NRR for B2B SaaS in 2025–2026 is 106% (Wudpecker / userlens, 2025), with top performers exceeding 120%.
- Product analytics are not optional. You cannot retain users you do not understand. Behavioural data, in-app feedback, and funnel analysis are how you find out why users leave and what makes them stay.
What Is User Retention?
User retention measures how many people continue to actively use your product over a given period. It is typically expressed as a percentage: of the users who were active at the start of a period, how many are still active at the end?
It is a usage metric, not a financial one. A user who logs in, completes tasks, and gets value from your product is a retained user. A user who still has an active subscription but has not logged in for three months is a retained customer but a lost user and that distinction matters, because lost users almost always become lost customers eventually.
A simple way to think about it: Customer retention answers "are they still paying?" User retention answers "are they still using it?" In B2B SaaS, where a single account can have dozens of users, the gap between these two metrics often signals churn months before it shows up in revenue.
User retention vs. customer retention
These terms get used interchangeably, but they measure different things. User retention is about individual engagement how many people actively interact with your product. Customer retention is about accounts and revenue how many paying customers renew.
In direct-to-consumer products, they are often the same thing: one person, one subscription. In B2B SaaS, they diverge significantly. An enterprise customer might renew their annual contract while half their team has stopped using the product. That is positive customer retention masking a serious user retention problem and it will catch up with you at the next renewal.
User retention vs. churn rate
Retention and churn are two sides of the same coin. If your monthly user retention rate is 95%, your monthly churn rate is 5%. The lower your churn, the better your retention. Both metrics tell the same story from different angles but retention is generally the more useful framing because it keeps you focused on the users who stayed, and more importantly, on understanding why they stayed.
Why User Retention Matters
Retention is not a nice-to-have metric. It is the metric. Here is why it drives everything else.
- It determines your unit economics. Acquiring a new customer costs 5 to 25 times more than retaining an existing one (Custify). Every churned user is money you spent to acquire someone who left before you broke even.
- It makes growth compound. Companies with NRR above 100% grow from their existing base alone without acquiring a single new customer. Median NRR for venture-backed B2B SaaS sits at 106% in 2025–2026, with top performers exceeding 120% (Wudpecker, 2025).
- It amplifies profit. Research by Bain & Company shows that improving retention by just 5% can increase profits by 25% to 95%. No other single metric moves profitability by that margin.
- It reduces support load. Retained users know the product. They generate fewer tickets, complete their own workflows, and are more likely to self-serve. Organisations that leverage product usage data report retention rates 15% higher than those that do not (Wudpecker, 2025).
- It drives organic growth. Happy, engaged users refer colleagues, leave reviews, and become your best marketing channel at zero marginal cost. Retained users are also dramatically easier to upsell companies have around a 60–70% chance of selling to an existing customer and only a 5–20% chance of selling to a new one (Marketing Metrics).
The cost of low retention is invisible until it isn't. Most SaaS teams obsess over acquisition: ad spend, SEO, sign-up conversion. But if the majority of those hard-won sign-ups disappear within 90 days, you are not solving a growth problem. You are running in place. Early churn within the first 90 days accounts for 60–70% of total annual churn across all segments (Growigami, 2026, citing Paddle/ProfitWell 2025). That makes the post-sign-up experience the most financially consequential part of your product.
How to Measure User Retention
You cannot improve what you do not measure. And measuring retention starts with knowing which metrics actually matter and how to calculate each one correctly.
Step 1: Calculate your retention rate
The foundational metric. It tells you what percentage of users remain active over a given period.
Formula: Retention Rate = ((Users at end of period − New users acquired during period) / Users at start of period) × 100. For example, if you started the month with 1,000 active users, acquired 200 new ones, and ended with 950 total active users, your retention rate is ((950 − 200) / 1,000) × 100 = 75%.
Step 2: Track these metrics
| Metric | What It Measures | Why It Matters |
|---|---|---|
| User Retention Rate | Percentage of users who remain active over a defined period | Your headline number. B2B SaaS targets 85–95% annually; average software retains ~39% of users after month one |
| Day 1 / Day 7 / Day 30 Retention | Whether new users return at key intervals after sign-up | Diagnoses onboarding quality. Day 1 tells you if your first impression lands. Day 30 tells you if users are forming a habit |
| Cohort Retention | Retention tracked separately for each signup cohort over time | The only way to know if your product is actually improving at retaining users rather than masking losses with new acquisition volume |
| Monthly Churn Rate | Percentage of users or customers lost per month | The leak in your bucket. SMB benchmark: below 3–5% monthly. Enterprise: below 1–2% monthly (ChurnFree, 2025) |
| Net Revenue Retention (NRR) | Revenue retained from existing customers, including expansion | An NRR above 100% means your existing base grows revenue without new acquisition. Median for B2B SaaS: 106% |
| Feature Adoption Rate | Percentage of active users who use a specific feature | Users with high feature adoption (70%+ usage) are twice as likely to stay long-term (Wudpecker, 2025) |
Step 3: Build a cohort retention view
Aggregate retention numbers hide the truth. Cohort retention groups users by when they signed up and tracks each group's retention separately over time. This is how you answer the question: "Is our product actually getting better at retaining users, or are we just acquiring more to mask the losses?"
If your January cohort retains 60% at Day 30 and your March cohort retains 72% at Day 30, your onboarding improvements are working. If both cohorts retain 60%, nothing you shipped in between made a difference. Cohort analysis is the only honest scoreboard for retention work.
Cohort retention curves from the example above: the March cohort flattens at 72% where January flattened at 60% — later cohorts retaining higher is the proof that your retention work is paying off.
User Retention Benchmarks by Segment (2025–2026)
Benchmarks are a starting point, not a goal. The goal is to improve your own retention over time. That said, knowing where your segment typically lands helps you understand whether you have a serious problem or a normal challenge.
| Segment | Annual User Retention | Monthly Churn | Net Revenue Retention |
|---|---|---|---|
| Enterprise SaaS (ACV >$100K) | 95%+ | <1–2% annual | 115–125% |
| Mid-Market SaaS ($25K–$100K ACV) | 90–95% | 1.5–3% monthly | 105–115% |
| SMB SaaS (<$25K ACV) | 80–90% | 3–5% monthly | 95–105% |
| B2C SaaS / Apps | 60–70% | 3–5%+ | Varies widely |
| AI-Native Tools | Lower (rapidly evolving) | Higher than traditional SaaS | ~48% (early-stage) |
Sources: ChurnFree B2B SaaS benchmarks (2025), Wudpecker B2B SaaS retention benchmarks (2025), Genesys Growth (2026).
The standout data point for 2026: AI-native tools are acquiring users rapidly but struggling to keep them. This creates a real opportunity for established products that invest in retention. If your users are deeply embedded in your workflows, the next shiny AI tool is far less of a threat.
What Drives User Retention (and What Kills It)
Retention is not a single lever. It is the result of a chain of experiences that either build momentum or quietly erode it. Here is what that chain looks like on both sides.
What drives retention
-
Fast time-to-value
Users who reach their first meaningful outcome quickly are far more likely to return. Every extra step between sign-up and the first value moment is a point where users drop off. The faster the product proves itself, the more the user believes it is worth coming back for.
-
Effective onboarding
Onboarding is where retention is won or lost. A user who completes onboarding and reaches their activation moment is dramatically more likely to become a long-term user. Data shows users who complete onboarding are 16% more likely to stay long-term (CSM Summit, 2023). Product tours, onboarding checklists, and contextual tooltips guide users to that moment without leaving them to figure things out on their own.
-
Habit formation
The product needs a natural usage loop a reason for users to come back regularly. If your product only solves a one-time problem, retention will always be structurally low. Products that embed into daily or weekly workflows retain users by default. What triggers should prompt a user to return? Answer that question and you have your retention engine.
-
Continuous value communication
Users need to know about new features, improvements, and updates that are relevant to them. A well-timed in-app announcement can re-engage a user who was quietly drifting toward cancellation. Without ongoing communication, users assume the product is stagnant even when it is actively improving.
-
Proactive analytics and intervention
Track user behaviour to identify at-risk users before they churn. If login frequency drops, if a user stops engaging with a core feature, or if a workflow is abandoned mid-way those are signals. Product analytics let you spot these patterns early and intervene with targeted guidance, contextual nudges, or customer success outreach. Companies using health scoring see NRR lift of 6–12 points (Benchmarkit, 2025).
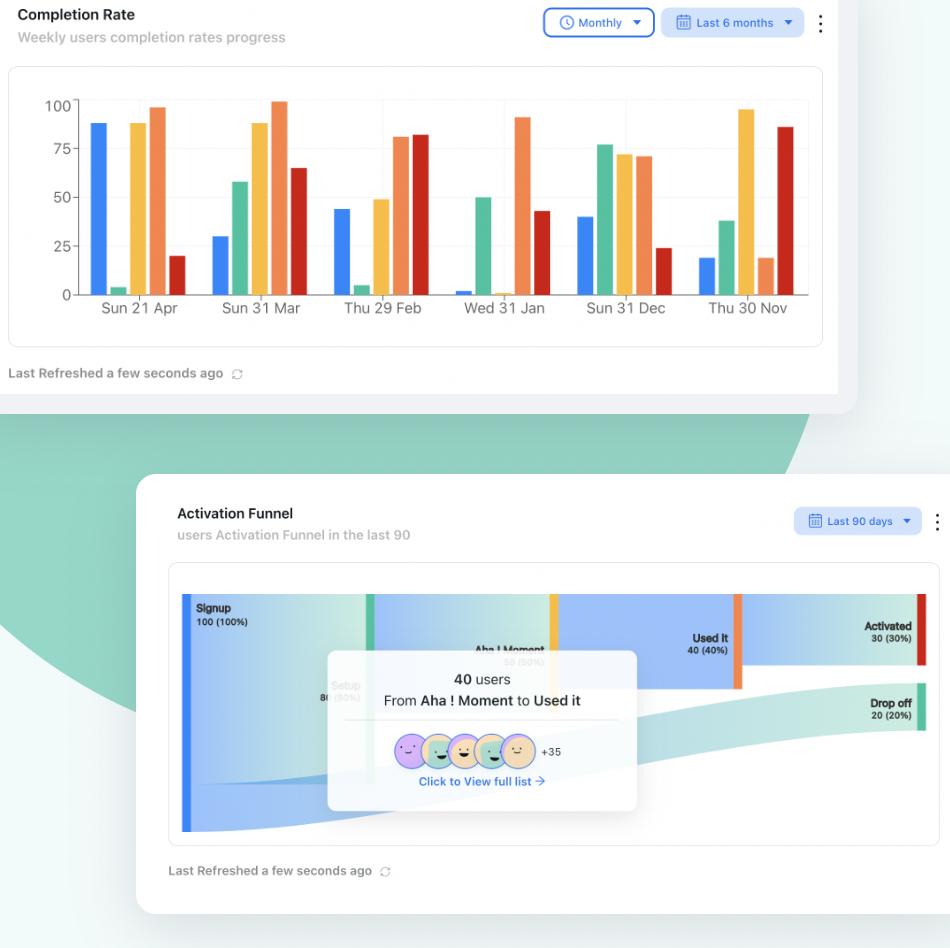
Onboarding analytics showing completion rates and drop-off points the data that tells you exactly where your product is losing users before they form a habit.
What kills retention
-
Poor onboarding (or none at all)
If users cannot figure out how to get value from your product within the first session, most of them will not come back. "The product speaks for itself" is a myth. It does not. Guide them or lose them.
-
Late value delivery
If users have to invest hours of setup before they see any payoff, you will lose them before the product gets a chance to prove its worth. Move the value moment as early in the experience as possible.
-
Feature overload without guidance
A product with 50 features and no guidance on which ones matter for a specific user is overwhelming. Segment your users, personalise the experience, and surface the features relevant to each person's role and goals. Everything else is noise.
-
Ignoring feedback signals
Support tickets, NPS scores, and usage drop-offs are all signals. If you are not collecting feedback in context right after the user engages and acting on it, you are flying blind while users silently drift toward the exit.
-
No communication after sign-up
Users who never hear from you after the initial sign-up assume you do not care. Regular, relevant in-app updates and announcements signal that the product is alive, improving, and worth coming back to.
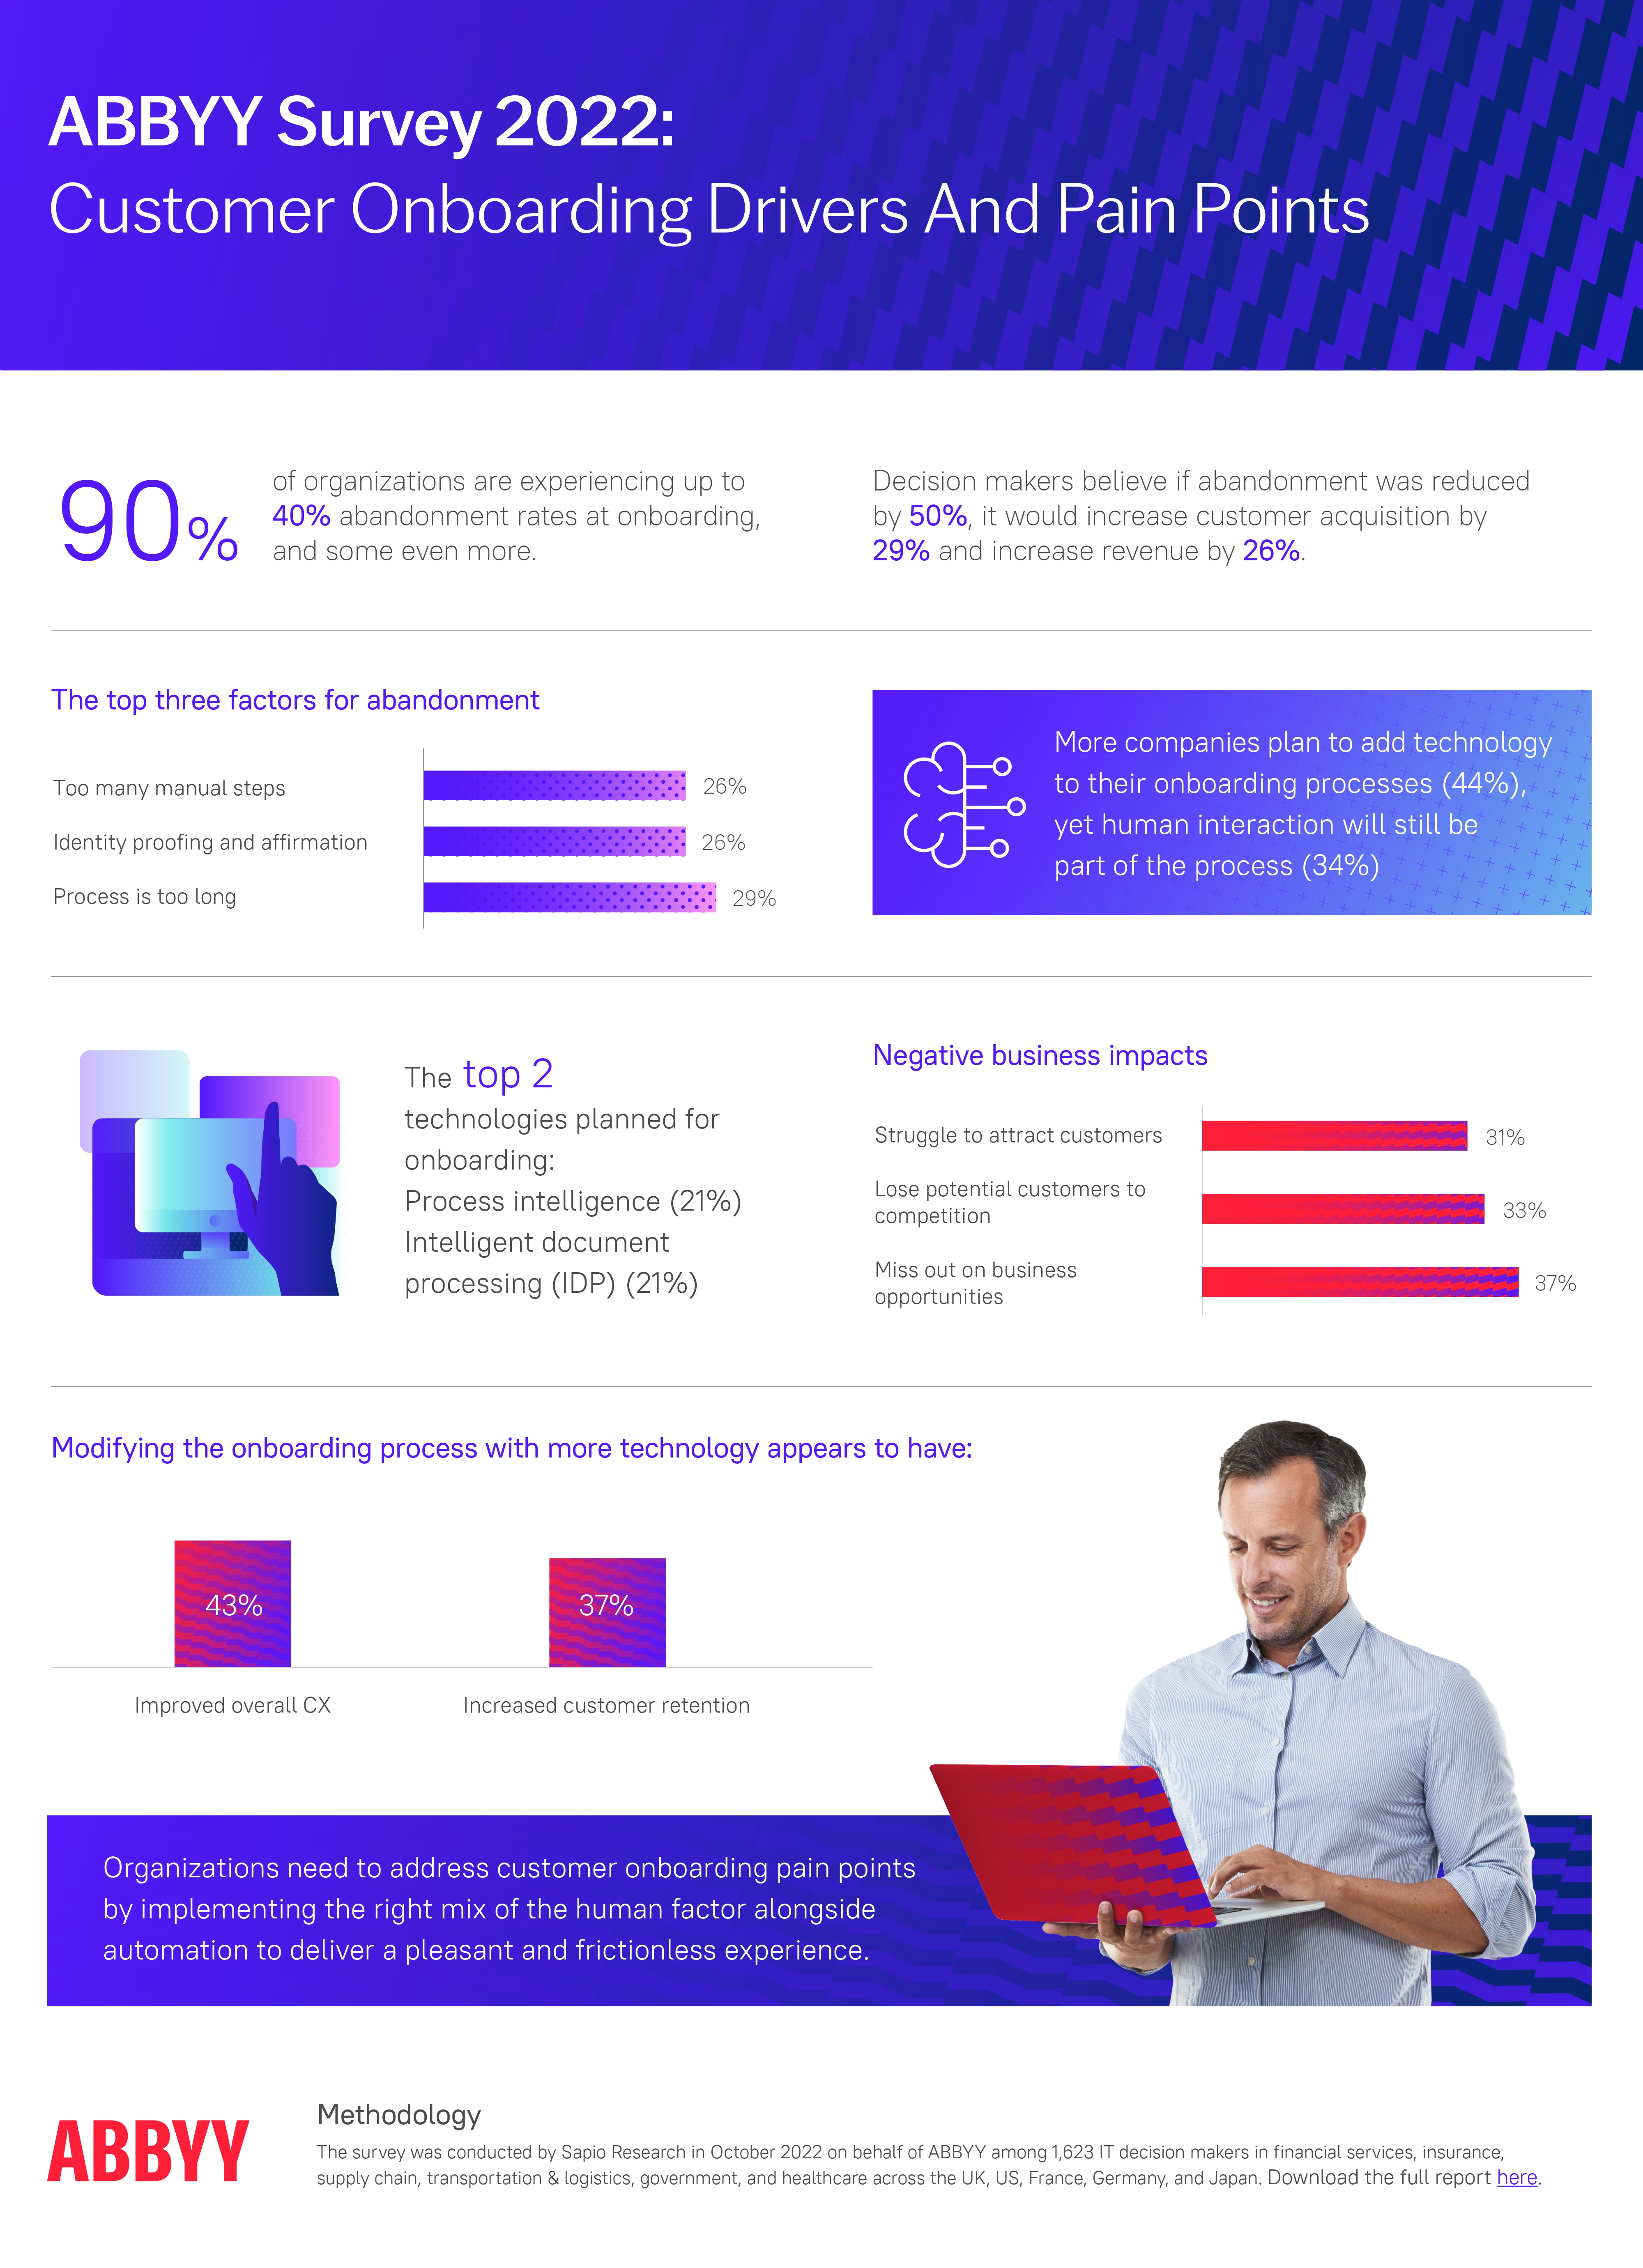
Survey data on why users abandon SaaS products poor onboarding and failure to reach a first value moment consistently top the list.
9 Proven Strategies to Increase User Retention
These are not abstract ideas. They are the specific, actionable strategies SaaS teams use to move retention numbers. Start with the ones closest to your biggest leak.
1. Fix your onboarding first
If your Day 1 and Day 7 retention numbers are weak, start here before anything else. Map the critical path from sign-up to the user's first value moment, then remove every unnecessary step. Build an interactive product tour that walks new users through the essentials, and use an onboarding checklist to give them a clear sense of progress. Better onboarding drives a 25% improvement in first-year retention, according to Wudpecker's 2025 benchmarks. This is the highest-leverage fix you can make.

An interactive product tour walks new users through their first key actions step-by-step the fastest route from sign-up to first value moment.
2. Segment users and personalise the experience
Not every user needs the same onboarding, the same features highlighted, or the same communication. Segment by role, plan tier, company size, or use case then tailor the experience for each group. A product manager and a developer logging into the same tool should see different tours, different tooltips, and different feature recommendations. One-size-fits-all onboarding is a retention killer.
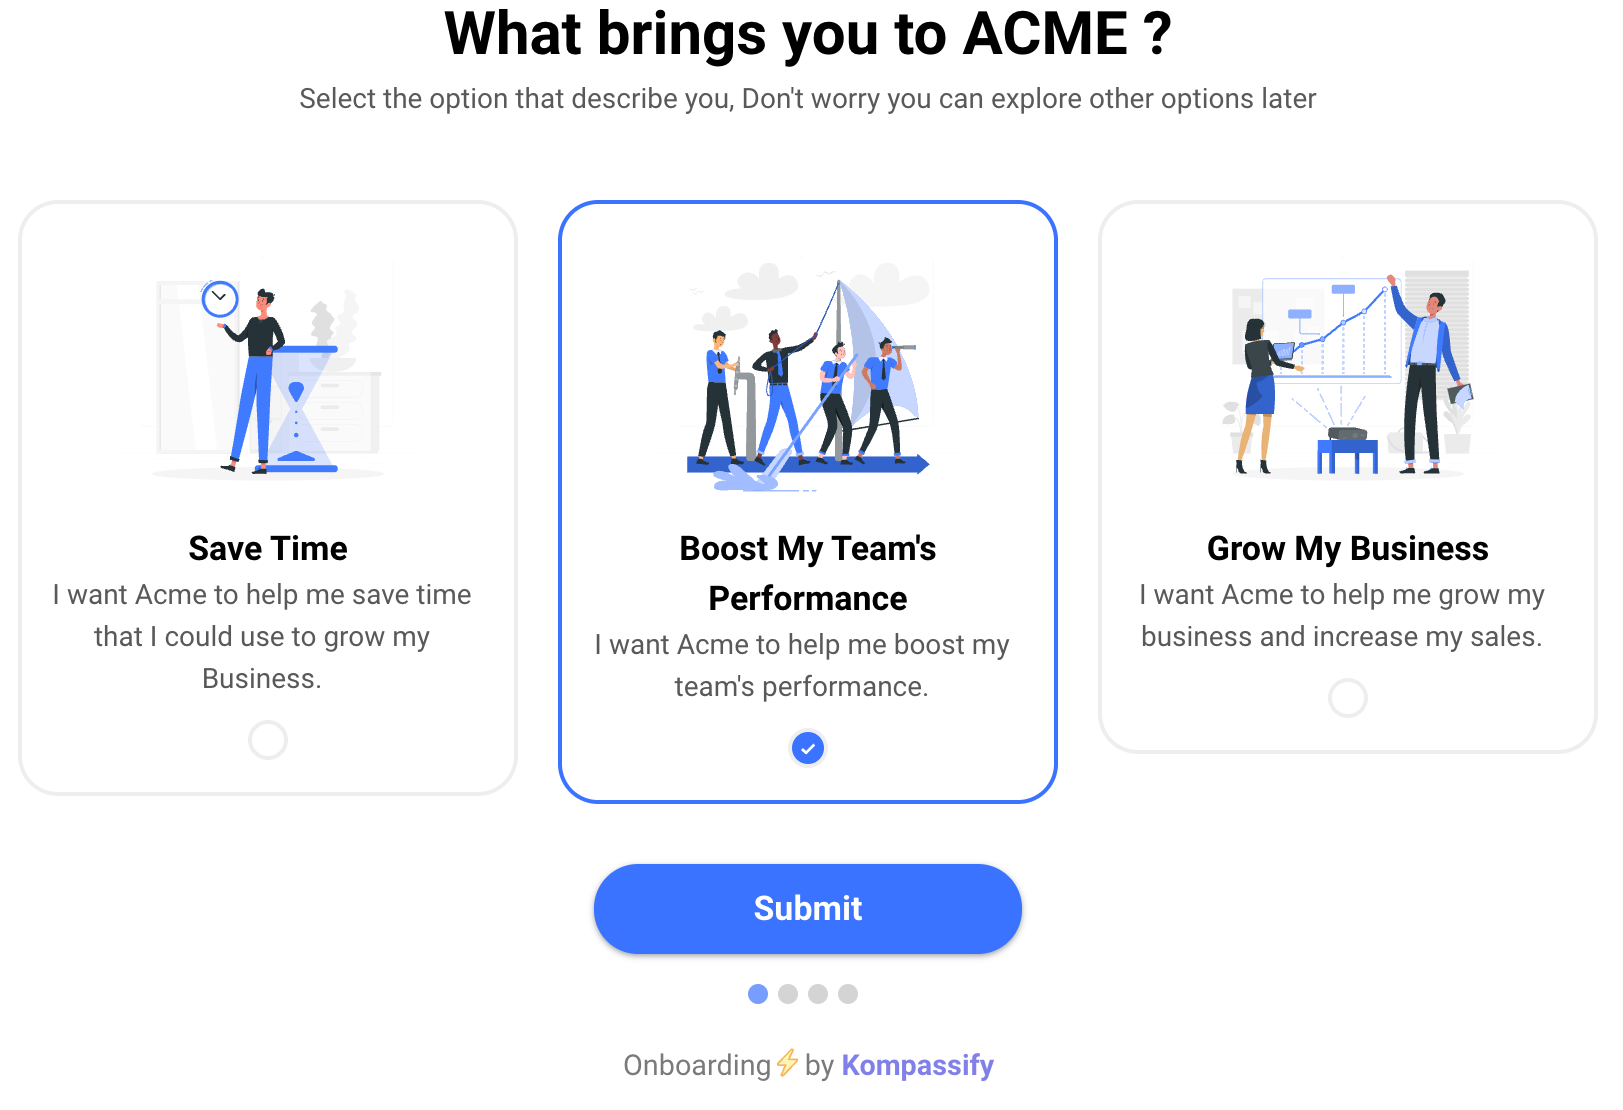
Role-based welcome screens let you personalise the onboarding flow from the very first interaction so each user segment sees the features most relevant to their job.
3. Shorten time-to-value
Audit your activation flow. How many steps does it take for a new user to complete their first meaningful action? If the answer is more than five, cut it down. Pre-fill data where possible. Offer templates. Skip optional configuration until users are ready for it. The faster users experience the product's core value, the more likely they are to come back. Every additional step between sign-up and the first value moment increases the risk of abandonment.
4. Announce new features to the right users
Features that go unannounced go unused and unused features do not drive retention. Use in-app announcements to reach active users in context, where they are most likely to pay attention and act. Segment your announcements: a developer-focused API update should not reach non-technical users. A well-timed feature announcement can re-engage a user who was quietly drifting toward cancellation.
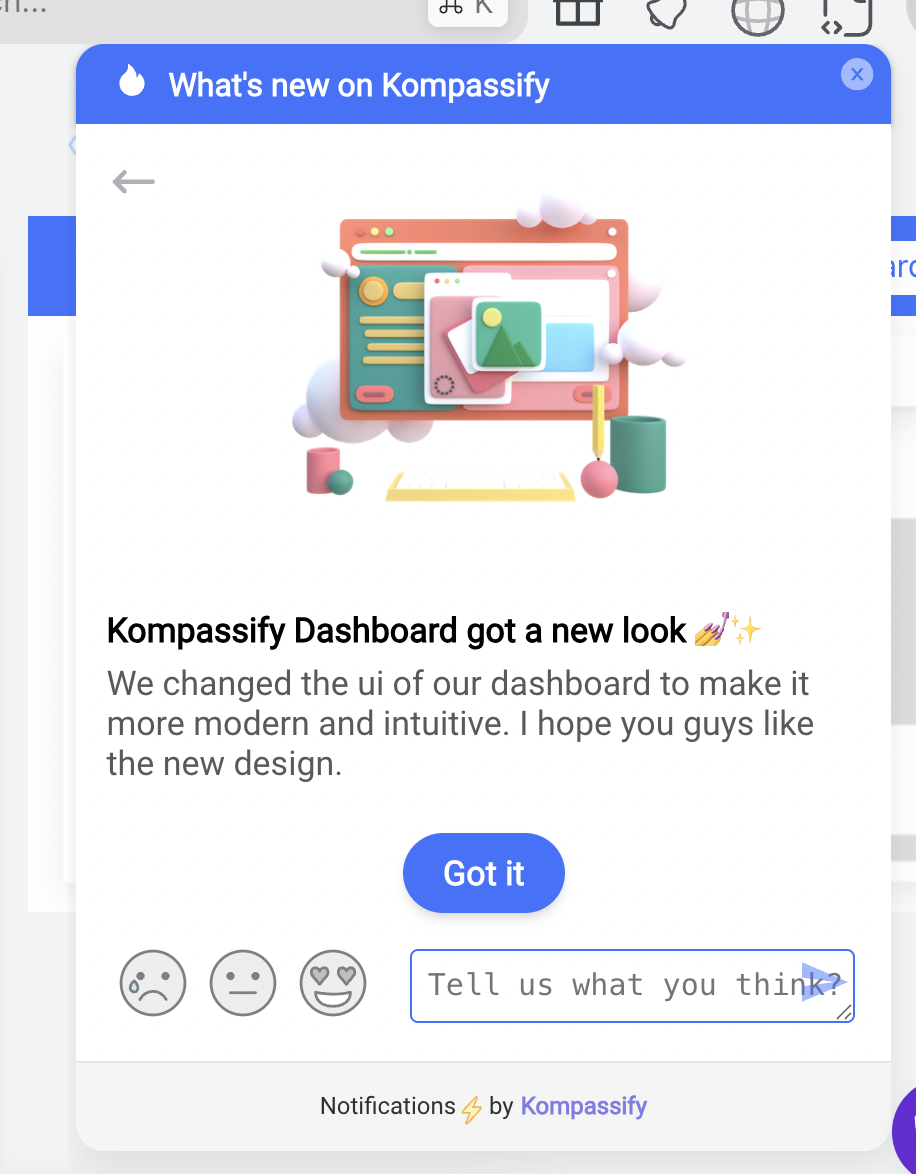
An in-app announcement widget that launches a guided tour directly from the notification so users don't just hear about the new feature, they experience it immediately.
5. Use product analytics to identify at-risk users early
Track feature usage, login frequency, and workflow completion rates. When a user's activity drops fewer logins, abandoned workflows, features they used to rely on now ignored that is a churn signal weeks before they cancel. Product analytics let you identify these patterns early, then intervene with a targeted in-app message, a guided tour to a feature they have not discovered, or a direct outreach from customer success.
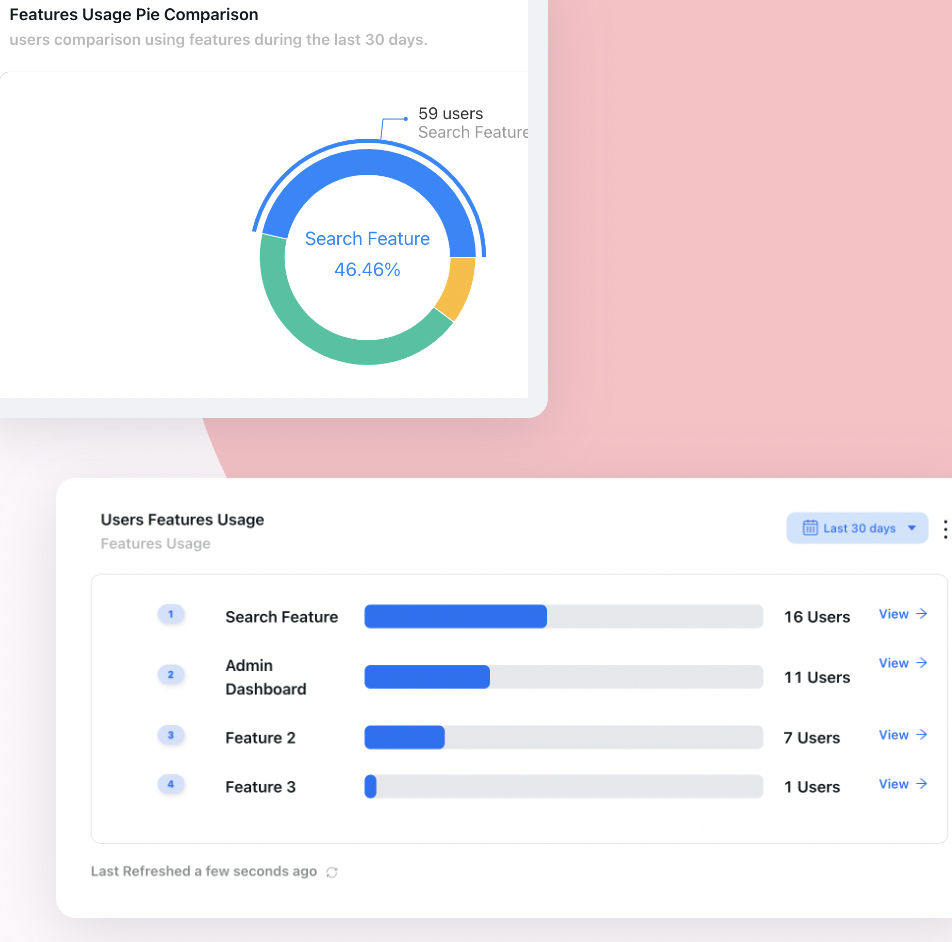
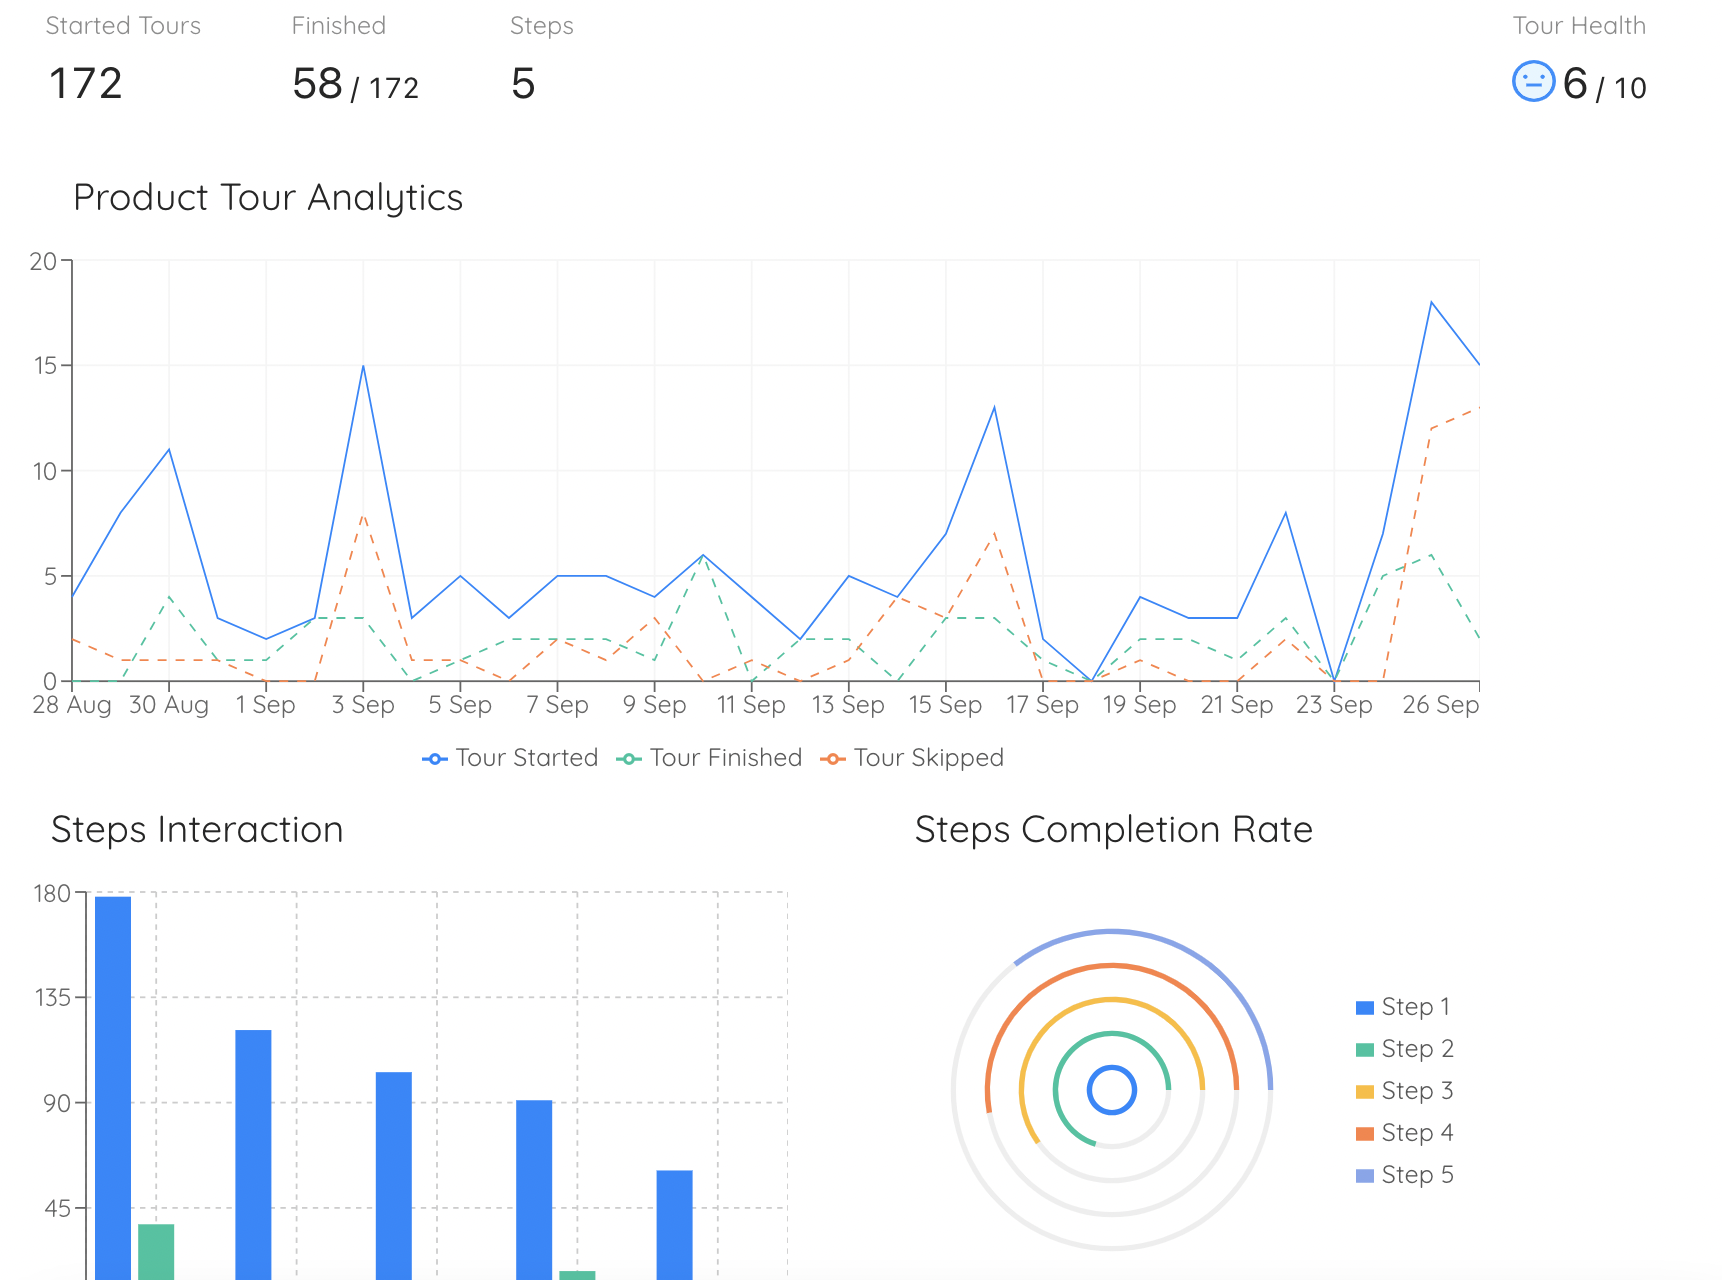
Feature usage analytics reveal which parts of your product drive engagement and which are silently abandoned so you can identify at-risk users and intervene before they churn.
6. Collect feedback in context, not after the fact
The best time to ask users how they feel is right after they interact with your product not three days later in an email. Embed micro-surveys, thumbs-up/down prompts, or NPS surveys directly inside your app. Response rates are dramatically higher, and the quality of feedback is better because the experience is still fresh. Use what you learn: update tooltips if users are confused, rewrite onboarding steps if they are dropping off, fix the feature if the feedback points to a real usability gap.
Collecting feedback in-app right after the user interacts when response rates are highest and the experience is still fresh.
7. Re-engage dormant users before they churn
A user who has not logged in for two weeks is not gone yet but they are on their way out. Set up automated triggers: if a user's activity drops below a threshold, send a contextual in-app message when they return, or an email nudge highlighting what they are missing. Show them new features, share a use case relevant to their role, or invite them to a guided tour. The goal is not to spam. It is to remind them of the value they are leaving on the table. Smart offers on cancellation flows cut voluntary churn by 12–15% (Recurly, 2025).
8. Invest in self-service support
Users who hit a wall and cannot find help leave. A well-maintained knowledge base, in-app tooltips on complex features, and contextual help links within the product reduce friction and prevent users from abandoning workflows. Every support ticket is evidence of a moment where the product failed to be self-explanatory. Reduce those moments and you reduce churn. This also lowers your cost to serve retained users know the product and generate fewer requests over time.
9. Track retention in cohorts, not averages
Aggregate retention numbers tell you nothing about whether your product is actually improving. Cohort analysis grouping users by sign-up date and tracking each group separately shows you whether changes to onboarding, features, or communication are working. If your Q1 cohort retains better than your Q4 cohort, your recent work is paying off. If they retain the same, you are running in place. This is how you turn retention into a practice, not a one-time project.
How Onboarding Drives Retention
If there is one section of this guide to take seriously, it is this one. Onboarding is the single highest-leverage moment in the entire user lifecycle. Get it right, and everything downstream adoption, retention, expansion gets easier. Get it wrong, and no amount of re-engagement campaigns will save you.
The journey from new user to retained user follows three stages.
The retention journey: onboarding executes the basics, activation delivers the first value moment, and habit creates the reason to keep coming back.
Stage 1: Onboarding execute the basics
The user needs to complete the essential setup: create their account, configure their first project, connect an integration, invite teammates. If there are critical setup steps, guide users through them as quickly as possible with an onboarding checklist that shows clear progress. Do not leave users to guess what to do next. Every moment of confusion in this stage increases the probability they never come back.
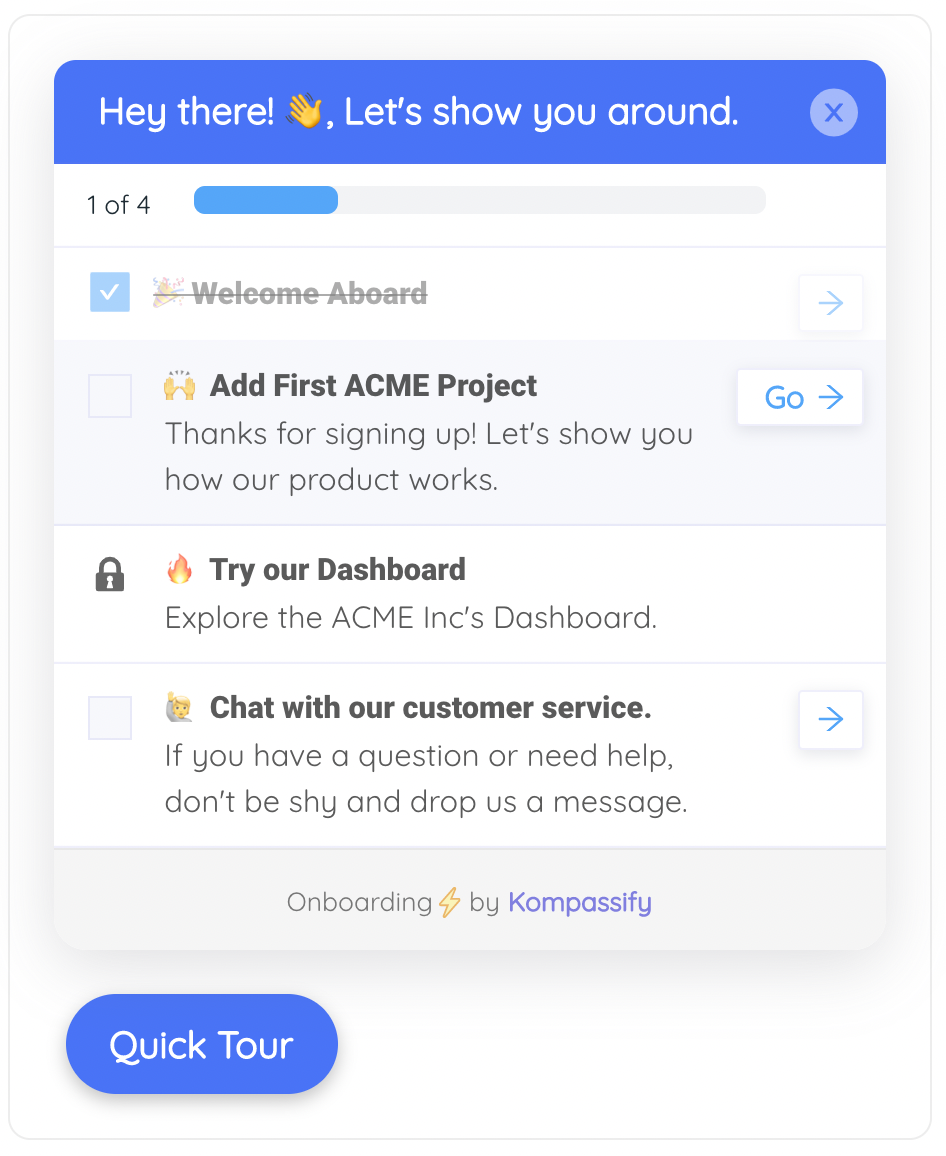
An onboarding checklist gives new users a clear map of what to do next reducing confusion and significantly lowering setup abandonment.
Stage 2: Activation deliver the first value moment
Once setup is complete, the user needs to experience the product's core value — this is the user activation stage. This is the Aha moment the point where they understand why your product exists and how it helps them specifically. A well-designed product tour accelerates this by walking the user through their first meaningful action, directly inside the product, without requiring them to read documentation or watch a video.
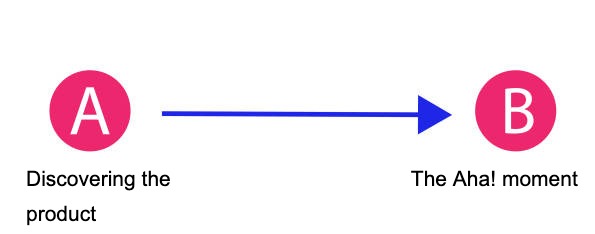
The Aha moment where a new user stops being a sign-up and starts experiencing real value. Getting users here quickly is the single most important thing onboarding can do for retention.
Stage 3: Habit create a reason to return
Value delivered once is not enough. The product needs a natural usage loop a trigger that brings the user back to complete another task. This could be a notification when something requires their attention, a scheduled report, or a workflow that naturally recurs. Combine these triggers with the inherent usage frequency of your product and you build a habit that sustains itself long after onboarding is over.
Early churn is a product problem, not a marketing problem. If users drop off within the first 90 days, the issue is almost always that the value moment came too late or that the onboarding flow never guided them to it at all. If users cancel after one billing cycle, it may signal that your product solves a temporary problem rather than an ongoing one. Both require product-level fixes. More re-engagement campaigns will not close a gap that onboarding failed to bridge.
User Retention vs. Customer Retention
These two metrics are related but distinct. Understanding the difference and tracking both gives you a complete picture of your product's health.
| Dimension | User Retention | Customer Retention |
|---|---|---|
| What it measures | Individual product usage and engagement | Account-level subscription renewals and revenue |
| Metric type | Usage metric | Financial metric |
| Unit of measurement | Individual users (logins, actions, features used) | Paying accounts or contracts |
| Typical timeframe | Daily, weekly, monthly | Monthly, quarterly, annually |
| Leading or lagging? | Leading indicator drops before revenue does | Lagging indicator reflects decisions already made |
| B2B relevance | Critical one account can have many users with varying engagement | Critical but can mask user disengagement if tracked alone |
| Danger signal | Users stop logging in while the account is still active | Accounts churn at renewal often a surprise if user retention was not tracked |
| Best tracked with | Product analytics, cohort analysis, feature usage data | CRM, subscription management, revenue dashboards |
The takeaway: If you only track customer retention, you will be surprised by churn. If you track user retention alongside it, you will see churn coming months in advance and you will have time to intervene. Kompassify's product analytics track user-level engagement so you can spot disengagement before it becomes a cancellation.
User Retention: Do's and Don'ts
A quick reference for the patterns that drive retention and the mistakes that destroy it.
✅ Do
- Design onboarding for the user's first value moment, not feature completeness
- Segment users and personalise onboarding, messaging, and feature discovery
- Use in-app channels tours, tooltips, announcement widgets to guide users in context
- Collect feedback immediately after user interaction, not days later
- Track retention in cohorts to measure real improvement over time
- Monitor usage patterns to identify at-risk users before they churn
- Announce new features to the users who actually need them
- Invest in self-service support: knowledge bases, tooltips, in-app help
- Treat retention as an ongoing product practice, not a quarterly project
❌ Don't
- Assume the product "speaks for itself" it does not
- Send the same onboarding flow to every user regardless of role or plan
- Rely on email alone for user engagement and re-activation
- Wait until renewal to check whether users are actually active
- Overwhelm new users with every feature at once
- Ignore declining login frequency until the user has already churned
- Use aggregate retention numbers without cohort analysis
- Treat churn as a customer success problem alone it is a product problem
- Ship features without announcing them to relevant users
Your User Retention Checklist
Use this checklist to audit and improve retention across your product. Not every item applies to every product, but every product should be doing the fundamentals well.
Onboarding & Activation
- Map the critical path from sign-up to first value moment
- Build an interactive product tour for new users
- Use an onboarding checklist to show progress and guide setup
- Segment onboarding by role, plan, or use case
- Remove unnecessary steps between sign-up and activation
Measurement & Analytics
- Track retention by cohort, not just aggregate numbers
- Monitor Day 1, Day 7, and Day 30 retention for every new user cohort
- Set up product analytics to track feature usage and workflow completion
- Build an adoption funnel: awareness → activation → retention → integration
- Calculate and track NRR alongside your user retention rate
Engagement & Communication
- Announce new features via in-app notification widgets, segmented by relevance
- Set up automated nudges for users whose activity is declining
- Collect in-app feedback immediately after key interactions
- Run NPS surveys at the feature level, not just product-wide
- Review support tickets as a passive feedback channel for retention issues
Ongoing Retention Practice
- Review retention metrics monthly treat it as a recurring team ritual
- Identify your highest-churn user segment and run targeted experiments
- Iterate on onboarding based on drop-off data, not assumptions
- Document what works and what does not build institutional knowledge
- Treat retention as a product problem, not just a customer success problem
Ready to Build a Product Users Actually Stick With?
Kompassify gives you product tours, onboarding checklists, announcement widgets, in-app surveys, and product analytics everything you need to onboard users, drive adoption, and increase retention, without writing a single line of code.
Start for Free →Frequently Asked Questions
What is user retention in SaaS?
User retention measures how many people continue to actively use your product over a given period. A retained user logs in, completes tasks, and gets genuine value from the product. A user who still has an active subscription but has not logged in for three months is a retained customer but a lost user and lost users almost always become lost customers before the next renewal.
What is a good user retention rate for SaaS?
B2B SaaS companies typically target 85–95% annual user retention. Enterprise products with high switching costs often exceed 95%, while SMB-focused tools see 80–90%. B2C SaaS retention tends to be lower, around 60–70%. On average, software retains only 39% of users after month one, according to 2025 SaaS benchmark data. The most important thing is to benchmark against your own segment and improve over time rather than chasing a universal number.
How do you calculate user retention rate?
The standard formula is: Retention Rate = ((Users at end of period − New users acquired during period) / Users at start of period) × 100. For example, if you started a month with 1,000 active users, gained 200 new ones, and ended with 950 total, your retention rate is ((950 − 200) / 1,000) × 100 = 75%. Track this monthly, quarterly, and annually to spot trends. Kompassify's product analytics can automate this tracking across user segments and cohorts.
What is the difference between user retention and customer retention?
User retention measures how many individual people continue to log in and use your product over a given period it is a usage metric. Customer retention measures how many paying accounts continue their subscription it is a financial metric. A single customer account can have many users. In B2B SaaS, a customer might retain their subscription while individual user engagement drops, which is a leading indicator of future churn months before it shows up in revenue.
What causes users to churn?
The most common causes of user churn in SaaS are: poor onboarding that fails to deliver an early value moment, a product that solves a one-time problem rather than an ongoing need, lack of engagement or habit formation, missing features that users expect, and better alternatives entering the market. Early churn within the first 90 days accounts for 60–70% of total annual churn across all SaaS segments (Paddle/ProfitWell, 2025 via Growigami). It is almost always a product or onboarding problem, not a marketing problem.
How does onboarding affect user retention?
Onboarding is the single highest-leverage moment for retention. Users who complete onboarding and reach their first value moment are dramatically more likely to become long-term active users. Data shows that users who complete onboarding are 16% more likely to stay long-term (CSM Summit, 2023). A well-designed flow using product tours, checklists, and contextual tooltips guides users to activation quickly. Kompassify lets you build these onboarding experiences without code and track exactly where users drop off.
What is net revenue retention (NRR) and why does it matter?
Net Revenue Retention measures the percentage of recurring revenue retained from existing customers over a period, including expansion revenue from upsells and upgrades. An NRR above 100% means your existing customer base is growing in revenue even without new acquisitions. In 2025–2026, the median NRR for B2B SaaS is around 106%, with top-performing companies exceeding 120% (Wudpecker, 2025). NRR above 100% is the clearest signal that your product delivers compounding value.