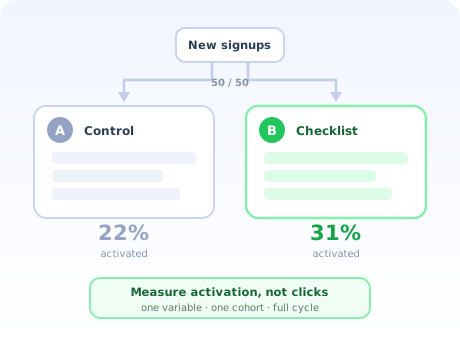
A/B testing a landing page is a solved problem. Change the headline, wait a few days, count the signups. The metric arrives in seconds, the traffic is large, and each visitor's outcome is independent of everyone else's.
Onboarding breaks all three of those assumptions. The outcome you care about arrives days after the change was seen. Your signup volume is a fraction of your visitor volume. And every user experiences the flow exactly once, which means you cannot re-run the moment that mattered.
None of that makes onboarding experimentation impossible. It makes it a different discipline, one where the value comes from testing fewer, larger changes against slower, better metrics. This guide covers what to test, what to measure, how much traffic you actually need, and what to do instead when you do not have it.
Key Takeaways
- Measure activation, not clicks. A variant can raise tour completion while lowering the number of users who get anything out of the product. Optimising the proxy is how that happens.
- Test big things. Small changes need traffic most SaaS products do not have. Checklist vs no checklist is testable; a button-colour change is not.
- The outcome metric is delayed. If activation typically takes a week, users who signed up yesterday cannot have activated. Including them corrupts the result.
- Fix the sample size before you launch. Onboarding metrics swing wildly early on, and there is almost always a moment where your preferred variant is winning.
- One variable per test. Change three things and a positive result tells you nothing about which one to keep.
- No traffic is not an excuse to guess. Five usability sessions, a before-and-after cohort comparison, or a painted-door test all beat an underpowered experiment.
What is A/B testing in onboarding?
Definition: A/B testing onboarding means randomly splitting new users between two versions of the onboarding experience and comparing them on a downstream outcome, usually activation rate. One group gets the current flow (the control), the other gets a single deliberate change (the variant). Each user is assigned once and stays in that variant for the entire test.
The mechanics are standard. What is not standard is the gap between cause and effect. On a landing page, the thing you changed and the thing you measure are seconds apart. In onboarding, you change something a user sees in minute two and measure whether they got value by day seven, with an entire product experience in between.
That gap is where most onboarding experiments go wrong, and it is why the rest of this guide spends more time on measurement than on mechanics.
Why onboarding A/B tests are harder
-
The metric is delayed
Activation might take an hour or a fortnight. Until every user in your sample has had the full window to activate, both variants are understated, and not necessarily by the same amount, which is how a delayed metric can actively invert a result.
-
The population is small
You are testing on signups, not visitors. A site with 50,000 monthly visitors and a 3% signup rate has 1,500 users per month to split, roughly one properly powered test per quarter, if you are testing something meaningful.
-
Each user sees it once
There is no second impression. A confusing variant does not just lose the test, it permanently costs you the users who received it, which is a real argument for running qualitative research first and testing only ideas that survive it.
-
Segments behave differently
A change that helps technical users can hurt non-technical ones, netting to "no effect". Aggregate onboarding results hide more than aggregate landing-page results do, so plan your segment breakdowns before you launch.
The practical consequence: you get a handful of real onboarding experiments per year, not dozens. Spend them on structural changes with a plausible mechanism behind them (ideas that came out of session recordings, drop-off data, or usability testing) rather than on a backlog of cosmetic variations.
What to measure: activation, not clicks
The single most common way to get a wrong answer from a correctly run test is to measure the wrong thing.
| Metric | Use it as | Why |
|---|---|---|
| Activation rate | Primary success metric | The only number that means a user got what they came for |
| Time to first value | Secondary success metric | Catches variants that activate the same share of users but faster |
| Day-30 retention | Final judge, if you can wait | The only metric that cannot be gamed by a persuasive first session |
| Step completion rate | Diagnostic only | Explains why a variant won or lost; a terrible success criterion |
| Tour / checklist completion | Diagnostic only | Trivially increased by making the tour shorter, which may help nobody |
| Time in onboarding | Guardrail | Ambiguous alone, could be engagement or could be confusion |
| Support tickets | Guardrail | A variant that wins on activation and doubles tickets has not won |
The proxy-metric trap deserves spelling out, because it is so easy to fall into. Suppose variant B shortens the product tour from eight steps to three. Tour completion jumps from 34% to 71% and the test is declared a success. But if those five removed steps were the ones that showed users how to do the thing they came for, activation may have fallen while your headline metric doubled.
Pick the activation event before the test, define it as a concrete value event, and do not change it mid-flight. Our guides to the aha moment and onboarding metrics cover how to choose it.
8 onboarding A/B tests worth running
Ordered roughly by expected effect size, which, given the traffic constraints above, is the order that matters.
1. Checklist vs no checklist
Show half of new users an onboarding checklist and half the plain product. This is usually the largest single lever available, because a checklist converts an open-ended "figure it out" into a short, finite list with a visible end.
Hypothesis: making the path explicit and finite raises activation. Measure: activation rate and time to value.
2. Fewer signup fields
Cut the form to email and password, and collect everything else later. Watch both halves of the funnel: signup rate and activation rate. The failure mode this test exists to detect is a form change that raises signups while lowering activation, because the removed fields were doing useful routing work, the tension our guides to signup flows and progressive profiling address.
3. Sample data vs empty state
Seed new accounts with a realistic example project instead of an empty screen. Structural, cheap to build, and frequently one of the biggest movers: an empty account asks the user to do the hardest part of the job with the least context. See our guide to empty states.
Guardrail: watch for users mistaking demo data for their own, which shows up as support tickets rather than as a metric.
4. Upfront tour vs contextual guidance
Control: a welcome tour on first login. Variant: no upfront tour, and short tooltips triggered when the user first reaches each relevant area.
This is the most informative test on the list, because the two philosophies produce genuinely different products. Contextual guidance usually wins on activation; upfront tours sometimes win on feature discovery. Knowing which applies to you is worth a quarter's traffic. Our guide to product tours that convert covers both patterns.
5. Personalised path vs one-size-fits-all
Ask one multiple-choice question, "what brings you here?", and branch the first session on the answer. The control gets the same flow for everyone.
Note that this tests two things at once: the cost of the question and the benefit of the branch. That is acceptable here because you would never ship the question without the branch, but be honest that a negative result does not tell you which half failed. Related: personalized onboarding.
6. Progress indicator vs none
Add a progress bar to a multi-step setup. Cheap to implement, and it exploits a reliable behavioural effect: people are more likely to finish something visibly close to completion.
Watch for: a progress bar that makes a long setup feel longer. Showing "step 2 of 9" can be worse than showing nothing.
7. Deferred vs immediate value demand
Control asks the user to import their real data before they see anything. Variant lets them explore first and import later. Tests whether your setup cost is being charged before the user has any reason to pay it.
8. Microcopy on the highest drop-off step
Rewrite the label, helper text, and button on the one step where your funnel bleeds most. Small in scope, but concentrated on the exact place where the loss occurs. See our UX microcopy guide.
Caveat: copy changes usually produce small effects, so this one needs more traffic than its simplicity suggests.
Sample size and duration: the honest version
This is the section most onboarding-testing advice skips, and skipping it is why so many teams run tests that could never have produced a conclusion.
The relationship is the important part: halving the effect you want to detect roughly quadruples the traffic you need. That single fact determines your entire experimentation strategy.
Three rules for stopping a test
- Reach the pre-calculated sample size. Decided before launch, written down, and not revised because the chart looks promising on day four.
- Run at least two full weeks. Weekday and weekend signups behave differently, and one week is one sample of a weekly cycle.
- Let the metric mature. If activation takes up to seven days, the last seven days of signups are not yet eligible to have activated. Either exclude them or wait.
Peeking is not a minor sin. Checking significance repeatedly and stopping the moment it appears dramatically inflates your false-positive rate: you are effectively running many tests and reporting the flattering one. With onboarding's noisy early data, a variant that is "clearly winning" on day three is the norm, not the signal. Set the end condition before you launch and honour it.
How to run an onboarding A/B test in 6 steps
Find the leak in your funnel
Diagnose it qualitatively before designing a variant
Write a falsifiable hypothesis with one variable
Calculate the sample size and the end date
Build both variants and verify the split
Analyse by segment, then ship or discard
1. Find the leak
Build the onboarding funnel from signup to activation and find the step with the worst conversion, the diagnosis at the heart of the pirate metrics framework. Test where the loss is, not where the idea is.
2. Diagnose before designing
Analytics tell you where. They never tell you why. Before building a variant, watch five session recordings of users who dropped at that step, or run a short usability test on the flow.
This step is what separates a test with a real chance of winning from a coin flip. A variant designed from an observed cause has a mechanism behind it; a variant designed from a brainstorm has a hope.
3. Write a falsifiable hypothesis
The format that keeps teams honest:
Because [what we observed], we believe that [the change] will [expected effect on the primary metric]. We will know we are right when [specific threshold].
Filled in: Because four of five test participants abandoned at the data-import step and said they did not have a file ready, we believe that offering a sample dataset will increase 7-day activation. We will know we are right when the variant's activation rate exceeds the control's by at least 20% relative, with 1,300 users per arm.
Change exactly one variable. Not the copy and the layout and the trigger: a win from a bundle of changes cannot be attributed, and you will end up shipping all three forever.
4. Calculate sample size and end date first
Take your baseline activation rate, decide the smallest improvement worth shipping, and compute the users needed per arm. Then divide by your weekly signup volume to get a duration. If that duration is longer than eight weeks, the test is not viable: either test something bigger or use one of the alternatives below.
5. Build both variants and verify the split
Assign each user once, on a stable identifier, and keep them in that variant for the whole test. Then verify: pull the split after the first fifty users and confirm it is close to 50/50 and that both variants render correctly for a real account.
Broken or badly assigned variants are the leading cause of wasted onboarding tests, and the damage is invisible until you analyse. Because Kompassify's tours, checklists and tooltips are targeted by segment and configured rather than coded, you can stand up both arms without a release, which also means a losing variant can be switched off in minutes.
6. Analyse by segment, then decide
Look at the aggregate first, then break it down by acquisition channel, plan, and any first-session attribute you collect. An aggregate "no effect" frequently conceals a strong positive in one segment and a negative in another, which is a shipping decision (roll out to one segment) rather than a discard.
Then genuinely decide. A test that ends with "interesting, let's leave it running" has cost you traffic and bought nothing.
What to do when you don't have the traffic
Most SaaS products cannot run valid A/B tests on their onboarding, and pretending otherwise produces underpowered tests whose false negatives block genuinely good changes. The alternatives are not consolation prizes; for small teams they are usually the better tools.
| Method | What you need | What it gives you | Best for |
|---|---|---|---|
| Usability testing | 5 participants | The cause of the drop-off, observed directly | Any drop-off you cannot explain |
| Before / after cohorts | Two comparable months | Directional evidence, confounded by seasonality | Large structural changes only |
| Painted door test | A link and a message | Demand evidence before you build | Deciding whether something is worth building at all |
| In-app survey at drop-off | One question | Stated reasons, in the user's words | Generating hypotheses cheaply |
| Session recordings | 10–20 sessions | Observed hesitation and rage-clicks | Finding friction you did not know existed |
The pragmatic policy for a small team: use qualitative methods to decide what to change, ship the change to everyone, and use a before-and-after cohort comparison to sanity-check that nothing got worse. Reserve genuine A/B tests for the two or three decisions a year that are expensive, reversible, and genuinely uncertain. A clear observed cause from five sessions is worth more than an underpowered test that concludes nothing.
Common onboarding A/B testing mistakes
✅ Do
- Define the activation event before launching
- Change exactly one variable
- Fix the sample size and end date in advance
- Run for at least two full weeks
- Let the outcome metric mature before analysing
- Break results down by segment
- Keep guardrail metrics on support tickets and retention
- Ship or discard; never leave a test running indefinitely
❌ Don't
- Optimise tour or checklist completion as the goal
- Stop the moment significance first appears
- Bundle several changes into one variant
- Include users who have not had time to activate
- Test cosmetic changes on low traffic
- Let users switch variants between sessions
- Run overlapping tests on the same flow
- Treat a null result as proof the idea was wrong
The most expensive mistake: testing the wrong thing carefully. A rigorously executed test of a button colour, on a flow whose real problem is that new users land on an empty screen with no idea what to do, will produce a clean, trustworthy, entirely useless result, while consuming a quarter of traffic you could have spent on the question that mattered.
Run Onboarding Experiments Without Shipping a Release
Kompassify lets you build product tours, onboarding checklists, tooltips and progress bars, target them to specific user segments, and measure activation with built-in product analytics, all without code. Free up to 100 monthly active users, GDPR-compliant and hosted in the EU.
Start for Free →Frequently Asked Questions
What is A/B testing in user onboarding?
A/B testing onboarding means randomly splitting new users between two versions of an onboarding experience and comparing them on a downstream outcome, usually activation rate. One group receives the current flow, the other receives a single deliberate change, and each user is assigned once and stays in that variant for the whole test. It differs from landing-page testing mainly in what you measure: the meaningful result arrives days after the change was seen, not seconds.
What should you measure in an onboarding A/B test?
Activation rate, defined as the percentage of users in each variant who reach a concrete value event such as sending a first invoice or publishing a first page. Step-completion and click-through rates are useful as diagnostics but are dangerous as success criteria, because a variant can easily increase tour completion while reducing the number of users who actually get anything out of the product. Where you can afford the wait, day-30 retention is a better final judge than activation.
How much traffic do you need to A/B test onboarding?
As a rough guide, detecting a 20% relative improvement on a baseline activation rate of about 25% needs roughly 1,000 to 1,500 users per variant. Smaller effects need dramatically more: halving the effect size you want to detect roughly quadruples the sample required. Most SaaS products below a few thousand signups a month cannot run valid onboarding A/B tests on small changes, which is an argument for testing bigger changes rather than for testing nothing.
How long should an onboarding A/B test run?
Long enough to reach the required sample size, at least two full weeks to cover weekly seasonality, and long enough for the outcome metric to have matured for every user in the sample. That last point is what teams miss: if activation typically takes seven days, users who signed up yesterday have not had the chance to activate, so including them will understate both variants and can invert the result. Stop on a preset sample size, not when the chart looks good.
What are the best onboarding A/B tests to run first?
Start with the structural experiments rather than cosmetic ones, because small changes need traffic you probably do not have. The highest-value first tests are usually adding an onboarding checklist versus no checklist, deferring signup fields to later in the journey, seeding a new account with sample data instead of an empty state, and replacing an upfront product tour with contextual guidance triggered where users get stuck.
Can you A/B test onboarding without enough traffic?
Yes, and you should. With low volume the honest options are qualitative usability testing with five participants to find the cause of a drop-off, before-and-after cohort comparison for large structural changes, and painted-door tests that measure demand before anything is built. These produce less statistical certainty than a split test, but a clear observed cause from five sessions beats an underpowered experiment that yields a false negative and blocks a good change.
What is the most common mistake in onboarding A/B tests?
Calling the result early. Onboarding metrics fluctuate wildly in the first days of a test, and it is almost always possible to find a moment where the preferred variant is ahead. Combined with a delayed outcome metric, this produces confident conclusions from noise. Fix the sample size and the end date before launching, and do not look at significance until both are reached. The close second is changing several things at once, which guarantees you cannot attribute the result.