Ask a SaaS team how growth is going and you will usually get a story. Traffic is up. The new campaign is performing. Churn feels a bit better than last quarter. Everyone leaves the meeting reassured and nobody has said anything falsifiable.
Pirate metrics exist to end that conversation. The framework does one thing: it splits the customer lifecycle into a handful of stages and insists on one number per stage. Once those numbers exist, "how do we grow?" collapses into a much better question: which stage is leaking the most, and what would it cost to fix it?
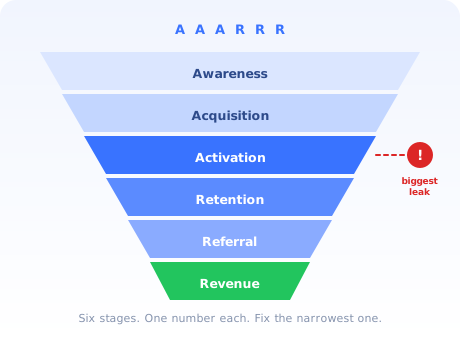
This guide covers what AARRR and AAARRR mean, the formula and a realistic benchmark for every stage, how the framework relates to RARRA and to your north star metric, and how to find the stage that is actually costing you money. Fair warning about where that usually lands: it is not acquisition.
Key Takeaways
- AARRR = Acquisition, Activation, Retention, Referral, Revenue. AAARRR adds Awareness in front. The initials spell "pirate", which is the entire joke.
- One number per stage, non-negotiable. The value of the framework is not the acronym; it is refusing to let any stage go unmeasured.
- Activation is where most SaaS funnels leak. It is also the cheapest stage to fix, because activation problems are usually onboarding problems, not product problems.
- Signup is not activation. If your activation event is "created an account" or "completed profile", you are measuring effort, not value, and your number is flattering you.
- Measure by cohort or don't bother. Blending this month's signups with two-year-old accounts produces numbers that move for no reason.
- It is a diagnostic, not a law. Real users churn and return, refer before they pay, and expand revenue years after activation. Use the stages as a checklist, not as a conveyor belt.
What are pirate metrics?
Pirate metrics definition: a growth framework that divides the customer lifecycle into five measurable stages (Acquisition, Activation, Retention, Referral and Revenue) so that a team can hold one clear number per stage and identify precisely where users are being lost. The initials spell AARRR, hence "pirate metrics". The extended AAARRR version adds Awareness at the top.
The framework was introduced by Dave McClure in 2007, at a moment when most startup reporting consisted of a single vanity number and a lot of optimism. Its lasting contribution is not the sequence of stages, which is fairly obvious, but the discipline it imposes: every stage gets a metric, and a stage with no metric is a stage nobody owns.
That is why it survives. A team with a full AARRR dashboard cannot claim growth is going well while activation sits at 12%. The number is there, in the room, and it belongs to someone.
The six stages of AAARRR explained
1. Awareness: do people know you exist?
The AAARRR addition, and a genuinely useful one. Acquisition in the original model means "arrived at your product", which quietly skips everything that happens before a person has heard of you. Separating the two lets you distinguish "nobody knows about us" from "people know about us and don't sign up", two problems with completely different fixes.
Metric: reach, impressions, branded search volume, share of voice. Owner: marketing.
2. Acquisition: do they arrive and sign up?
The stage where someone crosses from anonymous visitor to identifiable user. The core metrics are visitor-to-signup conversion rate and customer acquisition cost, ideally broken down by channel; an aggregate CAC hides the fact that one channel is subsidising three bad ones.
Two traps live here. The first is optimising signups without checking what happens to them afterwards, which produces a cheerful acquisition chart attached to a collapsing activation rate. The second is a signup form that leaks badly for reasons nobody has looked at in a year; see our guide to signup flow best practices.
3. Activation: do they actually get value?
The stage that decides whether the previous two were worth paying for, and the one teams define most loosely.
Activation is not account creation, profile completion, or finishing your product tour. It is the first moment the user gets something they came for: an invoice sent, a page published, a report shared, a teammate invited. Anything else is a proxy for effort, and effort proxies always look better than reality.
Getting this definition right is the highest-leverage measurement decision in the entire framework. Our guides to the aha moment and to increasing user activation cover how to find the event and how to move the number once you have it.
4. Retention: do they come back?
Retention is the stage that decides whether you have a business or an expensive treadmill. It is also the stage most vulnerable to measurement laziness: a single "monthly active users" figure can rise while every individual cohort is decaying, simply because acquisition is outrunning churn.
Measure it as a retention curve by cohort. The question you want answered is not "what percentage are active this month?" but "does the curve flatten, and at what level?" A curve that flattens at 40% is a product with a real audience. A curve that keeps sliding toward zero is a leaky bucket regardless of how good the top of the funnel looks.
5. Referral: do they bring others?
The stage most teams skip, usually because it is measured last and instrumented never. Referral is worth attention for an unsentimental reason: referred users typically activate faster and retain better, because they arrive with context and a recommendation from someone they trust.
The common mistake is bolting on a referral programme before the product is worth referring. Referral rate is a lagging indicator of satisfaction; if it is near zero, the fix is usually upstream in retention, not a bigger incentive.
6. Revenue: do they pay, and does that grow?
Trial-to-paid conversion, average revenue per account, and expansion. In modern SaaS the interesting part is rarely the first payment; it is whether revenue per account grows over time, which is what net revenue retention captures and what makes the difference between a business that compounds and one that has to re-earn its revenue every year.
Every pirate metric, with its formula
The stages are only useful once each one has a number attached. Here is the working set, with formulas and the ranges most B2B SaaS teams find themselves in. Treat the benchmarks as orientation, not as targets: they vary enormously by price point, motion, and market.
| Stage | Metric | Formula | Typical range |
|---|---|---|---|
| Awareness | Branded search share | Branded searches ÷ total category searches | Track the trend, not the level |
| Acquisition | Visitor-to-signup rate | Signups ÷ unique visitors × 100 | 2–5% for SaaS marketing sites |
| Acquisition | CAC | Total sales + marketing spend ÷ new customers | Aim for LTV:CAC above 3:1 |
| Activation | Activation rate | Users reaching the activation event ÷ signups in cohort × 100 | 20–40% is common; the best product-led teams reach higher |
| Activation | Time to value | Median time from signup to activation event | Minutes for self-serve; days for complex B2B |
| Retention | Day-30 retention | Cohort users active on day 30 ÷ cohort size × 100 | Depends on natural usage frequency |
| Retention | Monthly churn rate | Customers lost in month ÷ customers at start × 100 | 3–7% monthly for SMB; under 1% for enterprise |
| Referral | Referral rate | Users who referred at least one person ÷ active users × 100 | Usually low single digits without a deliberate programme |
| Referral | NPS | % promoters − % detractors | Above 30 is decent; above 50 is strong |
| Revenue | Trial-to-paid rate | Paying conversions ÷ trials started × 100 | ~15–25% opt-in trials; lower for no-credit-card |
| Revenue | Net revenue retention | (Starting MRR + expansion − churn − contraction) ÷ starting MRR | Above 100% is the goal |
Cohorts or nothing. Every rate above must be measured on a cohort, the users who signed up in a defined window, and followed forward in time. Calculating activation rate across your entire user base mixes people who signed up yesterday with people who signed up in 2023, and produces a number that drifts whenever your acquisition volume changes. That is not a metric; it is a mood ring.
AARRR vs AAARRR vs RARRA
Three acronyms, one set of stages, and a genuine argument about priority underneath.
| Framework | Order | The argument it makes |
|---|---|---|
| AARRR | Acquisition → Activation → Retention → Referral → Revenue | The original. Measure every stage of the lifecycle so leaks become visible |
| AAARRR | Awareness → Acquisition → Activation → Retention → Referral → Revenue | Reach and arrival are different problems and deserve different numbers |
| RARRA | Retention → Activation → Referral → Revenue → Acquisition | Same stages, reordered by priority: stop pouring water into a leaking bucket |
RARRA is best understood as a corrective rather than a competitor. It emerged because teams read AARRR as a strictly sequential funnel and concluded that acquisition came first, then spent years buying users who left. Putting retention at the front is an argument about where to invest, not a claim that customers somehow retain before they acquire.
The practical resolution: use AAARRR to structure your measurement (one number per stage, all six visible) and apply RARRA's logic when deciding where to spend. Then pick a single north star metric so the team has one shared direction rather than six competing dashboards. Pirate metrics diagnose; the north star aligns.
How to find the stage that is actually leaking
The point of the framework is triage. Here is the sequence that produces an answer rather than a dashboard.
Define one event per stage, in writing
Build the funnel on a single cohort
Calculate the conversion rate between each pair of stages
Find the worst conversion, not the smallest absolute number
Diagnose that stage qualitatively before changing anything
1. Define one event per stage, in writing
Ambiguity here poisons everything downstream. Write the definitions down and make them boringly concrete: "Activation = user has created a project and invited at least one collaborator, within 14 days of signup." If two people on the team would compute the number differently, the definition is not finished.
2. Build the funnel on a single cohort
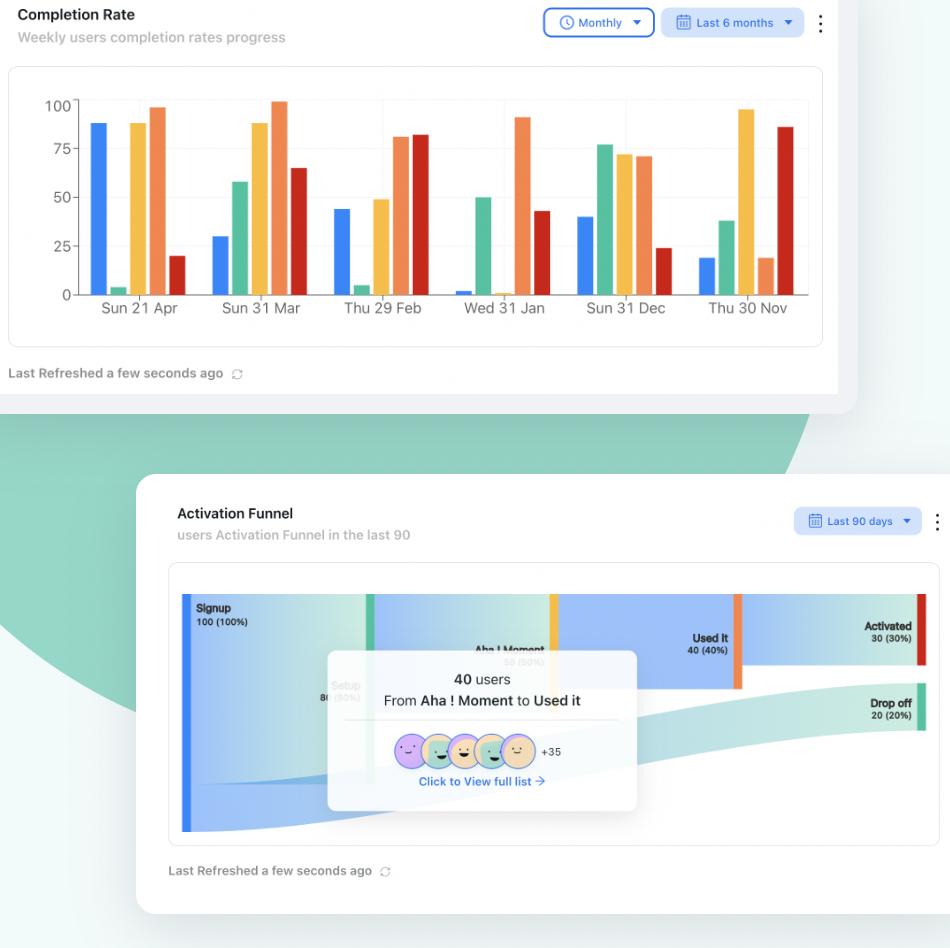
Pick one month's signups and follow only those users through all six stages. Resist the urge to look at everyone at once. A cohort funnel answers "what happens to a user who joins us today?", which is the only version of the question you can act on.
Kompassify's product analytics lets you define these events and build the funnel from in-app behaviour without shipping tracking code for each new question, which matters, because you will want to change the definitions three times before they are right.
3. Calculate the conversion between each pair of stages
Not the absolute counts: the rates. Signup to activation, activation to day-30 retention, retention to paid, and so on. Absolute numbers always shrink as you go down the funnel, which tells you nothing. The conversion rate between adjacent stages is where the information is.
4. Find the worst conversion, not the smallest number
This is the step teams get wrong. Revenue is always the smallest count in the funnel, so it always looks like the problem. It usually is not. If 3,000 people sign up and 750 activate, you are losing 75% of everyone you paid to acquire at a single step, and no amount of pricing-page work downstream will recover them.
5. Diagnose before you change anything
A leaking stage tells you where, never why. Before redesigning anything, spend a week on the qualitative half: watch five session recordings of users who dropped at that step, run a short usability test on the flow, and trigger a one-question in-app survey at the point of abandonment. Teams that skip this step end up shipping a redesign that moves the number sideways.
Why activation is usually the answer
Across product-led SaaS, the activation step is where the funnel narrows most sharply. There are three structural reasons, and all of them are good news.
-
It is the cheapest stage to improve
Improving acquisition means more spend or more content. Improving retention means changing the product. Improving activation usually means changing what a new user sees in their first ten minutes, a configuration change, not a roadmap item.
-
It compounds into every stage below it
A user who never reached value cannot retain, refer, or expand. Lifting activation by ten points lifts the ceiling on every downstream metric simultaneously, which is not true of any other stage.
-
Most activation problems are onboarding problems
Users rarely abandon because the product cannot do the job. They abandon because they could not work out how to make it do the job before their patience ran out, a guidance failure, not a capability failure.
Which is why activation work tends to look unglamorous and pay disproportionately:
Shorten the path to the activation event
List every step between signup and the activation event and delete anything that serves your database rather than the user's outcome. Team names, avatars and preference screens can all be asked for later, once the user has a reason to care. Our time to value guide covers how far this can be taken.
Make the remaining steps visible and finite
An onboarding checklist works because it converts an open-ended "figure this out" into a short, closed list with an end. Kompassify's onboarding checklist and progress bar exist for exactly that, and both are configured rather than built.
Guide the hard step, in place
There is almost always one step where the drop is concentrated. That step deserves a short product tour or a tooltip anchored to the exact element, triggered when the user arrives there, not a welcome modal on first login that nobody reads.
Fill the empty state
A new account with nothing in it asks the user to do the hardest part of the job with the least context. Sample data, templates, or an importer routinely move activation more than any copy change; see our guide to empty states.
Common pirate metrics mistakes
✅ Do
- Write one explicit event definition per stage
- Measure every rate on a cohort
- Define activation as value received, not effort spent
- Fix the worst conversion rate, wherever it sits
- Pair the funnel with one north star metric
- Segment the funnel: different segments leak in different places
- Diagnose qualitatively before redesigning
❌ Don't
- Treat the stages as a strict one-way sequence
- Use signup or profile completion as your activation event
- Report blended lifetime averages instead of cohorts
- Chase acquisition while activation is under 20%
- Add a referral programme before retention is healthy
- Build all six dashboards before fixing anything
- Change the definitions mid-quarter without saying so
The mistake that quietly costs the most: a flattering activation definition. "Completed onboarding" or "viewed the dashboard" will produce an activation rate around 70% and a retention curve that makes no sense, because most of those users never actually got anything. Teams then spend a quarter investigating a retention problem that is really an activation problem wearing a disguise.
A 30-day plan to stand up your pirate metrics
Week 1: Define
- Write one event definition per stage and get the team to agree in writing
- Pick the activation event by looking at what retained users did early that churned users did not
- Choose the cohort window (usually monthly signups)
Week 2: Instrument
- Track each event in your product analytics
- Build a single cohort funnel across all six stages
- Calculate the conversion rate between each adjacent pair
Week 3: Diagnose
- Identify the worst conversion rate in the funnel
- Watch five session recordings of users who dropped there
- Run a one-question in-app survey at the abandonment point
- Write down the top three hypotheses for the leak
Week 4: Fix one thing
- Ship the smallest change that addresses the leading hypothesis
- For activation leaks, start with a checklist or a contextual tour at the failing step
- Compare the next cohort against the last one, not against the blended average
- Only then move to the second-worst stage
Fix the Activation Leak Without Writing Code
Kompassify gives you no-code product tours, onboarding checklists, tooltips, progress bars and built-in product analytics, so you can find the stage that leaks and fix it in the same week. Free up to 100 monthly active users, GDPR-compliant and hosted in the EU.
Start for Free →Frequently Asked Questions
What are pirate metrics?
Pirate metrics is a growth framework that breaks the customer lifecycle into five stages: Acquisition, Activation, Retention, Referral and Revenue. The initials spell AARRR, which is why they are called pirate metrics. The framework was introduced by Dave McClure in 2007. Its purpose is to force a team to hold one number per stage so that growth conversations become specific: instead of asking how to grow, you ask which single stage is leaking the most users and fix that one.
What is the difference between AARRR and AAARRR?
AAARRR adds a sixth stage, Awareness, in front of Acquisition. Acquisition in the original model means getting someone onto your site or into your product, which quietly skips everything that happens before a person has heard of you at all. Adding Awareness separates reach from arrival, which matters for teams doing meaningful top-of-funnel work. The remaining five stages are identical, and both versions are used interchangeably in practice.
What does activation mean in pirate metrics?
Activation is the point at which a new user experiences real value from your product for the first time, not the point at which they create an account. A useful activation definition names a concrete, observable event that means the user got what they came for: sending a first invoice, publishing a first page, inviting a first teammate. If your activation definition is signup or profile completion, you are measuring effort rather than value, and the number will look healthier than the reality. Our guide to increasing user activation covers how to choose the event.
Which pirate metric should you focus on first?
Almost always activation. Acquisition is the most expensive stage to improve and the easiest to feel busy in; retention cannot be fixed for users who never reached value in the first place. Activation sits between them and is usually both the leakiest stage and the cheapest to change, because most activation problems are onboarding problems rather than product problems. Measure each stage, then improve whichever converts worst, but expect that to be activation.
How do you calculate activation rate?
Activation rate is the number of users who complete your activation event divided by the number of users who signed up in the same cohort, expressed as a percentage. The critical detail is that it must be measured by cohort rather than across all users at once, since blending recent signups with long-standing accounts will distort the figure. Track it alongside time to value, which tells you how much friction stands between signup and first value.
What is RARRA and how does it differ from AARRR?
RARRA reorders the same stages to put Retention first: Retention, Activation, Referral, Revenue, Acquisition. It is a response to teams treating AARRR as a strictly sequential funnel and pouring money into acquisition while the product leaked users at the bottom. The stages are the same; RARRA is an argument about priority rather than a different framework. In practice, most teams use AARRR or AAARRR to structure measurement and apply RARRA's priority when deciding where to invest.
Are pirate metrics still relevant for SaaS?
Yes, with one caveat. The framework remains a good way to structure measurement because it forces one clear number per lifecycle stage and makes leaks visible. The caveat is that the customer journey is not a strict one-way funnel: users churn and return, refer before they pay, and expand revenue long after activation. Treat pirate metrics as a diagnostic checklist rather than a literal sequence, and pair it with a single north star metric so the team has one shared direction.