Every SaaS company is, underneath the product, a machine that turns money into customers. Customer Acquisition Cost is the exchange rate. It tells you exactly how much you pay, in ads, salaries, and tools, for each new customer you win, and whether that trade is one you can afford to keep making.
The number seems simple: spend, divided by customers. But CAC is where growth strategy meets basic arithmetic, and it is unforgiving. A product can have a beautiful onboarding flow, a loyal user base, and a growing pipeline, and still quietly go broke because it costs more to acquire a customer than that customer will ever be worth.
That is why investors ask about CAC before almost anything else. Paired with lifetime value, it decides whether you have a business or an expensive hobby. And unlike vanity metrics, CAC responds to real levers, most of which have nothing to do with spending more on ads.
This guide covers the whole picture: what CAC is, how to calculate it (with worked examples), which costs to include, what counts as a good CAC in SaaS, how the LTV:CAC ratio and payback period work, and, most importantly, the practical ways to bring your customer acquisition cost down.
Key Takeaways
- CAC is what you pay to win one customer. Add up all sales and marketing costs over a period and divide by the new customers acquired in that same period.
- The formula is Total sales & marketing costs ÷ New customers. Include everything: ad spend, team salaries and commissions, software, agency fees, and content, not just the obvious ad budget.
- CAC is only meaningful next to LTV. The healthy benchmark is an LTV:CAC ratio of at least 3:1, and a payback period under 12 months. A €3,000 CAC can be great or fatal depending on what a customer is worth.
- Blended CAC flatters you. Free organic customers pull the average down. Track paid CAC separately to see the true cost of your acquisition spend.
- The cheapest lever is conversion, not cheaper ads. Turning more of the traffic you already pay for into paying customers lowers CAC directly, which is why activation and onboarding are CAC levers, not just retention levers.
- Retention and referrals compound. Customers who stay and recommend you bring in new ones for free, dragging your blended CAC down over time.
What Is Customer Acquisition Cost (CAC)?
Customer Acquisition Cost (CAC) is the total cost of convincing one prospect to become a paying customer. It bundles everything you spend to attract, nurture, and close new business, then spreads that spend across the customers you actually won. In plain terms: if acquiring customers were a vending machine, CAC is the price on the front.
The acronym is worth spelling out because it is often confused with adjacent terms. CAC stands for Customer Acquisition Cost, not "cost of customer acquisition" as a vague concept, but a specific, calculable per-customer figure. It sits in the family of unit-economics metrics that tell you whether growth is profitable, alongside lifetime value, gross margin, and payback period.
In SaaS, CAC matters more than in almost any other business model, because revenue arrives slowly, one subscription payment at a time, while acquisition cost is paid up front and in full. You spend €800 to land a customer today and earn it back over the next twelve months, if they stay. That timing gap is the entire challenge of SaaS finance, and CAC is the number that describes one side of it.
CAC is not your ad budget. The single most common mistake is treating CAC as "what we spent on Google Ads." Real CAC includes the salaries of everyone in sales and marketing, the tools they use, the agencies and freelancers on retainer, and the content you produce. Leave those out and your CAC will look artificially cheap, right up until the finance team asks why the model does not match the bank account.
Why CAC decides whether growth is healthy
Growth is easy to buy and hard to sustain. Any company can acquire more customers by spending more, the question is whether each of those customers pays back more than they cost. A rising customer count with a rising CAC and a flat lifetime value is not success; it is a slow-motion cash crisis. CAC keeps the conversation honest by forcing every acquisition euro to justify itself against the revenue it eventually returns.
How to Calculate CAC: The Formula and Examples
The calculation is deliberately simple: total the money you spent acquiring customers over a period, then divide by the number of new customers you won in that same period.
Both measured over the same period, and the cost side fully loaded: ads, salaries and commissions, tools, agencies, and content.
Formula: CAC = Total sales & marketing costs ÷ Number of new customers acquired. For example, if you spent €50,000 on sales and marketing in Q1 and signed 200 new customers, your CAC is €50,000 ÷ 200 = €250.
The arithmetic is trivial; the discipline is in the inputs. Both numbers must cover the same time window, and the cost side must be complete. Here is how the same 200 customers produce very different CAC figures depending on how honestly you count costs:
| What you count as cost | Total spend | New customers | CAC | Reading |
|---|---|---|---|---|
| Ad spend only | €20,000 | 200 | €100 | Flattering and wrong: ignores the people and tools that did the work |
| Ads + team salaries | €40,000 | 200 | €200 | Closer, but still missing tools, content, and agencies |
| Fully loaded (everything) | €50,000 | 200 | €250 | The real number you should plan and budget against |
Mind the lag between spend and signup. In SaaS, the customer who signs up in March may have first clicked an ad in January. If your sales cycle is long, comparing this month's spend to this month's new customers can distort CAC badly. For longer cycles, measure CAC over a quarter or align spend to the cohort it actually generated, rather than snapping to calendar months.
What Costs Go Into CAC?
A fully loaded CAC includes every cost incurred to turn strangers into paying customers. If a line item exists to attract, nurture, or close prospects, it belongs in the numerator.
- Paid advertising: Google, Meta, LinkedIn, retargeting, sponsorships, and any other paid media.
- Salaries and commissions: the fully loaded cost of your marketing and sales teams, including bonuses and sales commissions.
- Software and tools: CRM, marketing automation, analytics, ad platforms, and the rest of the acquisition stack.
- Agencies and freelancers: retainers and project fees for design, ads management, SEO, or content.
- Content production: the cost of producing blog posts, videos, webinars, and lead magnets that bring prospects in.
- Overhead allocation: a reasonable share of the general costs (office, management) attributable to the acquisition function.
What to leave out: costs of serving customers you already have (customer success, support, hosting, and account management) do not belong in CAC. Those are retention and cost-of-service line items. Mixing them in confuses the cost of getting a customer with the cost of keeping one, and the two need very different fixes.
What Is a Good CAC? (SaaS Benchmarks 2026)
Here is the honest answer nobody wants: there is no universal "good" CAC. A €4,000 CAC is outstanding for an enterprise platform sold on annual contracts and catastrophic for a €12/month tool. An absolute CAC number, on its own, is meaningless. It only becomes useful when you compare it to what a customer is worth and how quickly you get your money back.
That is why the two benchmarks that actually matter are ratios, not euro amounts:
| LTV:CAC ratio | Verdict | What it tells you |
|---|---|---|
| Below 1:1 | Losing money | Every customer costs more than they return. Unsustainable: fix acquisition efficiency or the product before scaling spend |
| 1:1 – 3:1 | Fragile | You are covering costs but with little margin for error. Common in early stage; needs to improve as you mature |
| 3:1 | Healthy | The classic SaaS benchmark: three euros back for every euro spent acquiring. Sustainable and fundable |
| Above 5:1 | Under-investing | Efficient, but often a sign you are being too cautious and leaving growth (and market share) on the table |
The other benchmark is the CAC payback period: how many months of subscription revenue it takes to earn back the acquisition cost. For SaaS, under 12 months is considered healthy, and best-in-class companies recover CAC in under 6 months. A short payback period means your cash comes back fast and you can recycle it into more growth; a long one means every new customer ties up capital and makes growth expensive to finance.
The comparison that matters is you versus you. Chasing an industry-average CAC is a distraction; methodologies, price points, and sales models vary too much for the comparison to mean anything. Track your own CAC over time, segment it by channel and cohort, and correlate movements with what you changed. A CAC that drops from €320 to €210 after an onboarding rework tells you more than any benchmark table ever will.
LTV:CAC Ratio and Payback Period Explained
CAC never travels alone. The two metrics that give it meaning are lifetime value and payback period, and understanding how they interlock is what separates teams who manage growth from teams who just spend on it.
The LTV:CAC ratio
Lifetime value (LTV) is the total revenue, or gross profit, you expect from a customer across their entire relationship with you. The LTV:CAC ratio simply divides the two: if a customer is worth €900 over their lifetime and cost €300 to acquire, your ratio is 3:1. That 3:1 is the widely accepted floor for a healthy SaaS business, you earn back three times your acquisition cost, leaving room for the cost of serving them and a profit besides.
Two ways to improve the ratio. You can lower CAC (spend less to acquire each customer) or raise LTV (keep customers longer, expand their accounts, reduce churn). The best growth teams work both ends at once, because a customer who stays longer is both cheaper to have acquired and more valuable to keep. This is why retention work improves your CAC economics even though it never touches the acquisition budget.
The payback period
Payback period answers a cash-flow question the ratio ignores: when do I get my money back? You calculate it as CAC divided by the monthly recurring revenue per customer, adjusted for gross margin. A €300 CAC on a customer paying €50/month at 80% gross margin has a payback of €300 ÷ (€50 × 0.8) = 7.5 months. The ratio can look healthy while the payback is dangerously long, and a long payback is what kills fast-growing SaaS companies: they run out of cash long before those profitable customers finish paying them back.
The CAC payback period from the worked example: at €40 of margin-adjusted revenue per month, a €300 CAC is recovered in 7.5 months, well inside the healthy 12-month benchmark.
Blended CAC vs. Paid CAC
Not all customers cost the same to acquire, and lumping them together hides the truth about your channels. This is the difference between blended and paid CAC, and mature teams track both.
| Blended CAC | Paid CAC | |
|---|---|---|
| What it counts | All sales & marketing spend ÷ all new customers | Paid acquisition spend ÷ customers from paid channels only |
| Includes organic? | Yes: SEO, word of mouth, and referrals pull the average down | No: measures the true cost of bought growth |
| Best for | The overall efficiency of the whole growth engine | Judging whether each paid channel is worth scaling |
| Failure mode | Flatters you: free customers mask expensive paid ones | Ignores the compounding value of organic and brand |
If your blended CAC looks great but you cannot explain why, it is often because organic and referral customers, who cost almost nothing, are quietly subsidising inefficient paid channels. Splitting the two tells you where to cut and where to double down. Better still, break paid CAC down by channel, so you can see that LinkedIn is bringing customers at €600 while content-driven signups arrive at €90.
How to Reduce Customer Acquisition Cost
Here is the part most CAC guides get wrong: they tell you to lower your ad bids. Real CAC reduction rarely comes from cheaper clicks, it comes from converting more of the traffic you already pay for, and from keeping customers so they bring you more for free. These are the levers that actually move the number in SaaS.
1. Convert more trials into customers
This is the highest-leverage move, and it is invisible on the ad dashboard. If you double the share of signups that reach their Aha moment and convert to paid, your CAC halves, on the exact same spend. A guided first session, a product tour, and a short onboarding checklist that gets users to value fast are among the cheapest CAC reductions available, because you are improving the denominator instead of the numerator.
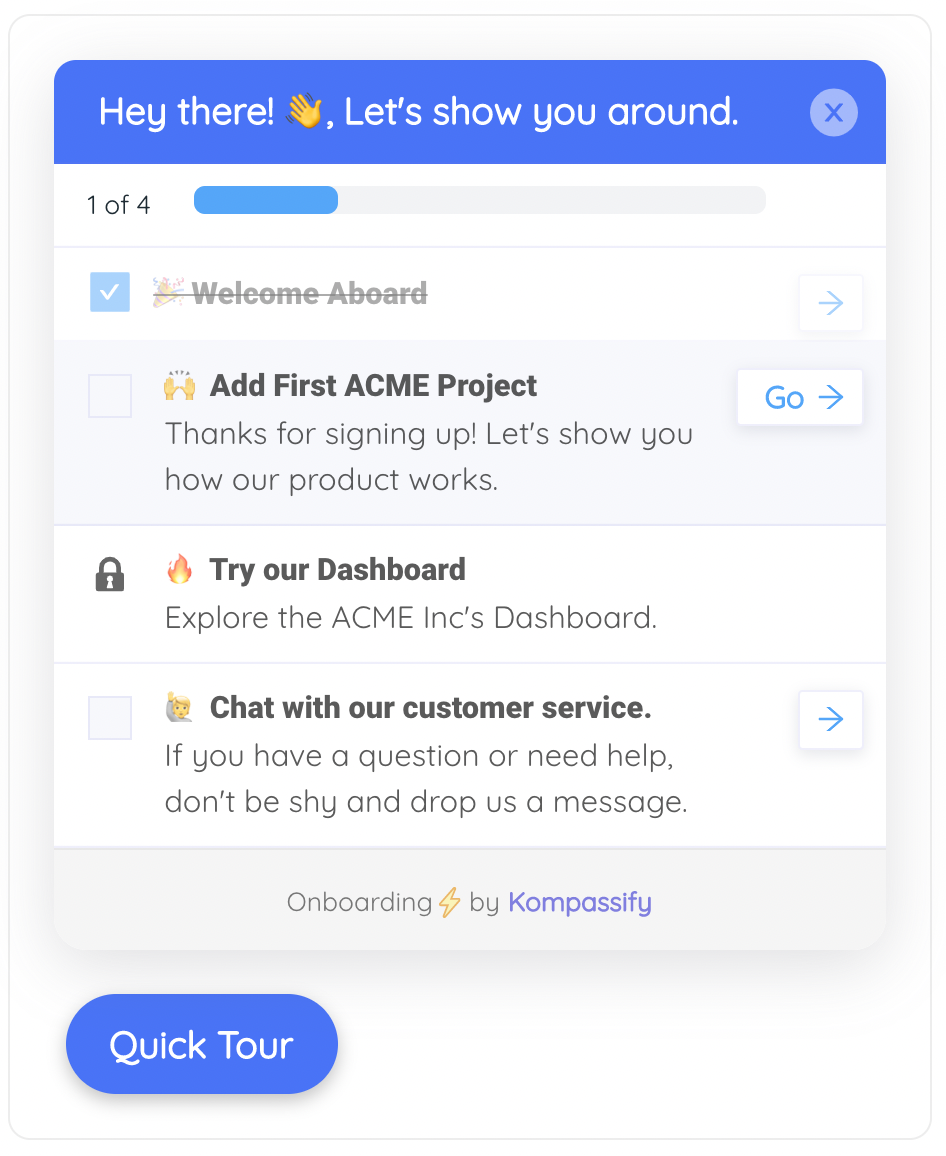
A Kompassify onboarding checklist gets more of the traffic you already paid for to activation, lowering CAC without touching the ad budget.
2. Shift toward a product-led, self-serve motion
Every customer who onboards themselves is a customer you did not pay a sales rep to close. A product-led growth motion, where the product does the selling through free trials, guided walkthroughs, and in-app education, systematically lowers the cost per customer as you scale. The more your product walkthroughs can carry a user from signup to paid without human touch, the flatter your acquisition cost stays as volume grows.
3. Turn retention and referrals into free acquisition
Customers who stay and recommend you are the cheapest acquisition channel that exists. Every referral, review, or word-of-mouth signup arrives at a paid CAC of zero, dragging your blended number down. That makes retention a CAC strategy: a high Net Promoter Score is quite literally an acquisition discount, because promoters bring you customers your competitors have to pay for.
4. Shorten time to value
The longer it takes a new signup to experience value, the more of them abandon before converting, and abandoned trials are pure wasted acquisition spend. Contextual onboarding, tooltips at the moment of confusion, and checklists that surface the shortest path to value all compress time to value, which lifts conversion and lowers CAC in the same motion.
5. Focus spend on your highest-intent channels
Not all channels are equal, and paid CAC by channel usually reveals a wide spread. Cut or shrink the channels bringing expensive, poorly-fitting customers, and reinvest in the ones delivering cheap, high-retention ones. The goal is not the lowest CAC at any cost, it is the lowest CAC for customers who stay, because a cheap customer who churns in a month is more expensive than an average one who stays for years.
Do not cut CAC by attracting the wrong customers. The easiest way to lower CAC on paper is to chase cheap, low-intent signups, discount seekers, tourists, users who will never fit your product. They convert cheaply and churn fast, wrecking your LTV and payback while the CAC line looks great. Always judge acquisition efficiency by CAC and the retention of the customers it brings, never CAC alone.
Common CAC Mistakes to Avoid
CAC is simple to define and easy to miscalculate. These are the errors that make the number lie to you.
- Counting only ad spend. Leaving out salaries, tools, and agencies produces a CAC that looks half its real size, until the P&L disagrees.
- Ignoring the sales-cycle lag. Matching this month's spend to this month's signups distorts CAC whenever your buying cycle is longer than your reporting period.
- Reading CAC without LTV. A CAC number in isolation cannot tell you whether it is good. Always pair it with the LTV:CAC ratio and payback period.
- Optimising for the lowest CAC. The cheapest customers are often the worst-fitting and fastest to churn. Optimise for CAC of customers who retain, not CAC overall.
- Blaming acquisition for a conversion problem. If trials do not convert, the fix is usually onboarding and activation, not more or cheaper traffic.
CAC: Do vs. Don't
A quick reference for keeping your customer acquisition cost honest and healthy.
✅ Do
- Include all sales and marketing costs, not just ads
- Always read CAC alongside LTV and payback period
- Track blended and paid CAC separately
- Break paid CAC down by channel
- Improve activation to convert traffic you already pay for
- Treat retention and referrals as acquisition levers
- Align spend to the cohort it actually generated
- Judge channels by CAC and downstream retention together
❌ Don't
- Report CAC as your ad budget divided by customers
- Compare your CAC to unrelated companies' benchmarks
- Chase the lowest possible CAC at the expense of fit
- Ignore the lag between spend and signup
- Mix in customer-success and support costs
- Scale paid spend before the unit economics work
- Assume more traffic fixes a conversion problem
- Look at blended CAC only and miss expensive channels
CAC vs. LTV vs. Payback: How They Fit Together
CAC is one instrument on the unit-economics dashboard, and it is most useful read alongside the metrics it depends on. Each answers a different question about the same customer.
| CAC | LTV | Payback period | |
|---|---|---|---|
| The question | What does one customer cost to acquire? | What is one customer worth over their life? | How fast do I get my acquisition cost back? |
| Measured in | Currency per customer | Currency per customer | Months |
| Improved by | Better conversion, self-serve, cheaper channels | Retention, expansion, reduced churn | Lower CAC or higher early revenue per customer |
| Healthy target | Whatever keeps LTV:CAC ≥ 3:1 | At least 3× CAC | Under 12 months |
The through-line connecting all three is the customer experience after signup. Better onboarding lifts conversion (lowering CAC), improves retention (raising LTV), and gets customers to paid value faster (shortening payback). One well-built activation flow moves every number on this table at once, which is exactly why it is the highest-ROI place to invest.
Lower Your CAC by Converting More of the Traffic You Already Pay For
Kompassify helps you turn more signups into paying customers with no-code product tours, onboarding checklists, in-app announcements, and surveys, so the same acquisition spend produces more customers. GDPR compliant, EU-hosted, and free for under 100 monthly active users.
Start for Free →Frequently Asked Questions
What is Customer Acquisition Cost (CAC)?
Customer Acquisition Cost is the total amount a company spends to acquire one new paying customer. You calculate it by adding up all sales and marketing costs over a period (ad spend, salaries, tools, agency fees, content, and commissions) and dividing by the number of new customers won in that same period. It is a core unit-economics metric because it shows how much it costs to grow and, compared against lifetime value, whether that growth is profitable.
How do you calculate CAC?
CAC = Total sales and marketing costs ÷ Number of new customers acquired, both over the same period. Example: €50,000 of sales and marketing spend in a quarter that produced 200 new customers gives a CAC of €50,000 ÷ 200 = €250. Be sure to include every acquisition cost: paid ads, team salaries and commissions, software, agencies, and content, not just the ad budget.
What is a good CAC for SaaS?
There is no universal figure: a good CAC depends entirely on what a customer is worth. The reliable benchmarks are ratios: an LTV:CAC of at least 3:1 (you earn back three times what you spent to acquire) and a payback period under 12 months. Below a 1:1 ratio you lose money on every customer; above 5:1 you may be under-investing in growth.
What is the LTV:CAC ratio?
The LTV:CAC ratio compares a customer's lifetime value against what it cost to acquire them. A 3:1 ratio is the healthy SaaS benchmark, three euros back for every euro of acquisition spend. A ratio near 1:1 means you barely break even, and a very high ratio like 6:1 usually signals you are spending too little on growth. It is the clearest single lens for judging whether acquisition spend is sustainable.
What is CAC payback period?
CAC payback period is the number of months of subscription revenue it takes to recover the cost of acquiring a customer, calculated as CAC ÷ (monthly recurring revenue per customer × gross margin). For SaaS, under 12 months is healthy and best-in-class is under 6. A short payback means cash returns quickly and can be reinvested; a long one ties up capital and makes growth expensive to finance.
What is the difference between blended CAC and paid CAC?
Blended CAC divides total sales and marketing spend by all new customers, including organic ones from SEO, referrals, and word of mouth. Paid CAC divides only paid acquisition spend by the customers that spend generated. Blended CAC looks lower because free customers pull the average down; paid CAC shows the true efficiency of your ad and sales investment. Track both, and break paid CAC down by channel.
How can you reduce customer acquisition cost?
The fastest lever is usually converting more of the traffic you already pay for, not buying cheaper ads. Improving activation and onboarding turns more trials into customers, so the same spend produces more customers and CAC falls. Other proven levers: a product-led, self-serve motion to cut sales cost per customer; stronger retention and referrals so happy customers acquire new ones for free; shorter time to value with product tours and checklists; and focusing spend on your highest-intent channels. Tools like Kompassify improve in-product activation without engineering work, and there is a free plan for under 100 monthly active users.