Most companies do not suffer from having no metrics. They suffer from having forty, distributed across teams that each optimise their own and collectively move the business nowhere. Support drives ticket resolution time down by closing conversations faster; growth drives signups up by loosening qualification; both dashboards look excellent.
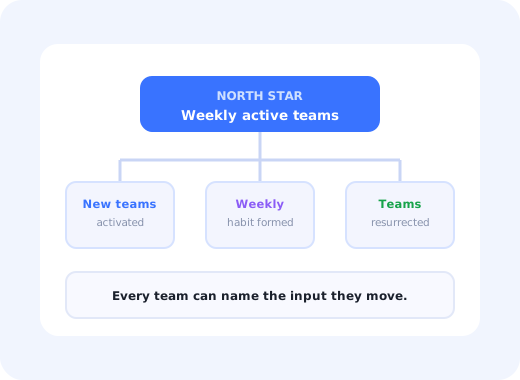
A north star metric is the response: one number, chosen because it only goes up when customers get value, that every team can trace their work back to.
This guide covers what a north star metric is, the four tests a candidate has to pass, how to choose one in five steps, how to build the input tree underneath it, and the failure modes that make most attempts collapse within two quarters.
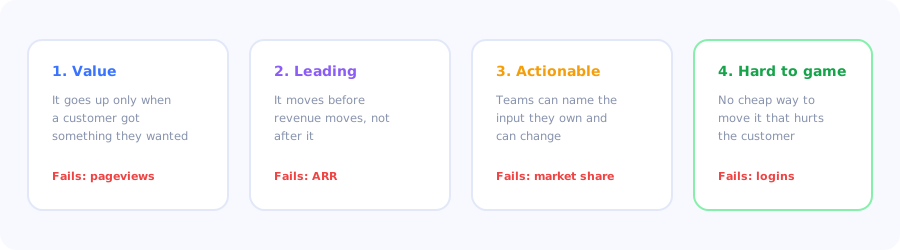
Four tests. Most candidate metrics fail at least one of them.
Key Takeaways
- A north star metric measures delivered customer value, not company outcome. Revenue is the result, not the star.
- It must pass four tests: it reflects value, it leads revenue, teams can act on it, and it cannot be gamed cheaply.
- The input tree is the useful part. A metric no team can influence is a poster, not a system.
- Include a quality qualifier: "active" and "weekly" do more work than the noun in front of them.
- One per company, not one per team. Multiple north stars is just a KPI list with better branding.
- Onboarding usually owns the largest input, because every north star starts with users reaching value once.
What is a north star metric?
North star metric definition: the single measure that best captures the value a product delivers to its customers, chosen so that moving it reliably moves long-term revenue. It sits above team-level KPIs, is reported consistently across the company, and is broken down into a small tree of input metrics that individual teams can own and influence.
The critical word is customers. Revenue, ARR and margin are outcomes for the company; a north star metric is an outcome for the user that predicts them. That distinction is what stops the metric from being optimised in ways that damage the business: you cannot inflate "teams that completed a report this week" by discounting.
The four tests
| Test | The question | Typical failure |
|---|---|---|
| Value | Does it rise only when a customer got something they wanted? | Pageviews, sessions, time in app |
| Leading | Does it move before revenue rather than after? | ARR, renewals, gross margin |
| Actionable | Can each team name an input they own and can change? | Market share, brand awareness |
| Hard to game | Is there a cheap way to move it that hurts customers? | Logins, emails sent, tickets closed |
The qualifier carries the meaning. "Users" is a bad metric; "weekly active teams that completed a report" is a good one. The adjectives do the work: they encode frequency, unit of value and quality. If your candidate metric has no qualifier, it is almost certainly gameable.
How to choose one in 5 steps
Write down the value exchange in one sentence
List the candidate events that represent it
Test each candidate against revenue history
Add the qualifier
Build the input tree before you announce it
1. Write down the value exchange in one sentence
"Customers pay us so that their team can X." The X is what your metric has to measure. If the sentence takes a paragraph or has three clauses joined by "and", the company does not yet agree on what the product is for, and picking a metric will not resolve that; it will surface it, which is useful in itself.
2. List the candidate events that represent it
For each candidate, write the exact query: which event, which unit (user, account, team), which window. Candidates that cannot be written as a query are ideas, not metrics. Aim for three to five, not one: the comparison is where the thinking happens.
3. Test each candidate against revenue history
Look backwards: did accounts with a higher value of this metric in month one retain and expand more? A candidate that does not separate your retained cohorts from your churned ones is not predictive, however appealing it sounds. This is also the moment to check for the reverse causality trap: big accounts do everything more, so normalise by size.
4. Add the qualifier
Take the winning candidate and tighten it until it cannot be moved without a customer being better off. Add the frequency ("weekly"), the unit ("team", not "user"), and the quality bar ("completed", not "started"). Each addition removes a way for the number to lie to you.
5. Build the input tree before you announce it
A north star metric with no inputs is a poster. Decompose it into three or four drivers that map to actual teams: typically new accounts reaching value, existing accounts increasing frequency, and dormant accounts returning. Each team should be able to point at one node and say "that one is mine".
The input tree
Almost every north star decomposes into the same three motions, whatever the product:
-
New value delivered
Accounts reaching the qualifying behaviour for the first time. This is activation, and it is the input onboarding owns; see the user activation guide.
-
Value repeated
Accounts doing it again at the target frequency. This is habit and depth, driven by feature discovery and by removing friction from the repeated task.
-
Value recovered
Accounts that stopped and came back. Usually the most neglected node, and the one where in-app re-engagement and churn work overlap.
Under those three sit the metrics teams already track: time to value, completion rates, feature adoption. Our onboarding metrics guide covers the definitions for the activation branch, which in most SaaS products is the largest single lever on the whole tree.
The star belongs on one slide. The inputs belong in a dashboard someone checks weekly.
Why north star programmes fail
Picking a company outcome instead of a customer one
Revenue, ARR and retention are all lagging results. Choosing one as the north star produces a metric nobody can move this quarter and a set of teams who go back to their own dashboards within a month.
Choosing something teams cannot influence
If a designer cannot draw a line from their work to the number, the number is decoration. The test is not whether the metric is important; it is whether the input tree reaches every team that is supposed to care.
Having several
Three north stars is a KPI list with better branding. The entire value of the exercise is the forced trade-off when two teams want opposite things; multiple stars remove exactly that.
Never changing it
A metric chosen when the product had one use case can quietly stop describing the business. Reviewing it annually is healthy; changing it quarterly is chaos. The signal to revisit is when teams start explaining why their work does not show up in it.
Do's and don'ts
✅ Do
- Measure delivered customer value
- Write the metric as a query before adopting it
- Test candidates against retention history
- Add frequency, unit and quality qualifiers
- Build the input tree first
- Give every team one node they own
- Review it once a year
❌ Don't
- Use revenue or ARR as the north star
- Pick a metric nobody can influence
- Run more than one at a time
- Count sessions, logins or pageviews
- Announce it before the tree exists
- Let account size distort the analysis
- Change it every planning cycle
Moving the activation input with Kompassify
Whatever your north star is, its first input is almost always the same: accounts reaching the qualifying behaviour for the first time. That is an onboarding problem, and it is the fastest node on the tree to move.
- Instrument the funnel to the qualifying event in product analytics.
- Guide the first completion with a focused product tour.
- Bound the setup with an onboarding checklist.
- Recover the third node with in-app messages targeted at accounts that stopped.
- Track the effect on the same funnel, week over week, per segment.
Kompassify is a no-code digital adoption platform for SaaS teams: tours, checklists, tooltips, announcements, surveys and analytics in one place. Free up to 100 monthly active users, paid plans from $129/month, GDPR-compliant with EU hosting.
Move the input, not the poster
Get more accounts to the behaviour your north star counts, guided in-product, measured in the same funnel.
Start for Free →Frequently Asked Questions
What is a north star metric?
A north star metric is the single measure that best captures the value a product delivers to its customers, chosen so that moving it reliably moves long-term revenue. It sits above team-level KPIs, is reported consistently across the company, and is decomposed into a small tree of input metrics that individual teams can own. The critical word is customers: revenue and ARR are outcomes for the company, while a north star is an outcome for the user that predicts them.
What makes a good north star metric?
Four tests. It reflects value, meaning it only rises when a customer got something they wanted. It leads revenue rather than following it. It is actionable, so every team can name an input they own and can change. And it is hard to game, with no cheap way to move it that hurts the customer. Qualifiers do most of the work: weekly active teams that completed a report is a usable metric, while users is not.
Should revenue be the north star metric?
No. Revenue, ARR and retention are lagging results of value already delivered, so choosing one produces a number no team can move within the quarter, and teams quietly return to their own dashboards within a month. The point of a north star is to sit one step upstream of revenue, at the behaviour that causes it, so that improving it today shows up in revenue later.
How do you choose a north star metric?
Write the value exchange in one sentence: customers pay us so that their team can do X. List three to five candidate events that represent X, each written as an exact query with an event, a unit and a window. Test each candidate against history to see whether accounts scoring higher in month one retained and expanded more, normalising for account size. Tighten the winner with frequency, unit and quality qualifiers. Then build the input tree before announcing anything.
What is an input metric?
An input metric is one of the three or four drivers a north star decomposes into, each owned by a specific team. Almost every north star breaks into the same three motions: new value delivered, meaning accounts reaching the qualifying behaviour for the first time; value repeated, meaning accounts doing it again at the target frequency; and value recovered, meaning accounts that stopped and came back. Underneath those sit the metrics teams already track, such as time to value and feature adoption.
Can a company have more than one north star metric?
It can, but doing so removes the reason to have one. Three north stars is a KPI list with better branding: the entire value of the exercise lies in the forced trade-off when two teams want opposite things, and multiple stars restore exactly the ambiguity the metric was meant to resolve. If different business lines genuinely deliver different value, the usual answer is separate trees per line rather than several stars for one product.
How often should you change your north star metric?
Review it annually and change it rarely. A metric chosen when the product had one use case can stop describing the business as the product broadens, and the signal to revisit is teams beginning to explain why their work does not show up in it. Changing it every planning cycle destroys the comparability that makes it useful, since a metric's value comes partly from a long, consistent history.
How does onboarding affect the north star metric?
It usually owns the largest single input. Whatever the north star counts, its first branch is accounts reaching the qualifying behaviour for the first time, which is the definition of activation. That makes onboarding the fastest node on the tree to move: instrument the funnel to the qualifying event, guide the first completion with in-app guidance, and measure the same funnel week over week rather than reporting on guidance published.