Sooner or later someone asks the question that composite metrics exist to answer: "is engagement up or down?" There is no single event you can count that answers it. Logins say nothing about value, feature counts say nothing about frequency, and active-user totals move with acquisition. So teams build an index, a product engagement score, that folds several usage signals into one number they can put on a slide and watch over time.
The most common formulation combines three things: how much of the product an account actually uses (adoption), how often people come back (stickiness), and whether usage is spreading (growth). Average them and you get a score out of 100 that is genuinely useful for spotting trends and comparing segments, and genuinely dangerous if you ever quote it without the breakdown underneath.
This guide covers the formula, how to calculate each component from data you already have, a worked example, when to change the weights, how PES differs from a health score or an NPS, and (the part most articles skip) what you actually change in the product to move each component.
Key Takeaways
- PES = (Adoption + Stickiness + Growth) / 3, each expressed as a percentage, giving a score between 0 and 100.
- It is a convention, not a standard. There is no official definition, so the version that counts is the one you write down for your product.
- External benchmarks are close to meaningless: the score depends entirely on how many features you count and how often your product is meant to be used.
- Never show the score without its three components. An average of three numbers can stay flat while two of them move in opposite directions.
- Segment it or it will mislead you. One PES for all accounts blends your power users and your dormant ones into a number that describes neither.
- Each component has its own lever: discovery for adoption, workflow fit for stickiness, second-wave onboarding for growth.
What a Product Engagement Score Is
Product engagement score, in one paragraph
A product engagement score (PES) is a composite index, normally scored from 0 to 100, that combines several product-usage metrics into a single figure so engagement can be tracked over time and compared across segments or accounts. The standard version averages three components (adoption, stickiness and growth) each expressed as a percentage. Unlike a survey metric it is calculated entirely from behaviour, and unlike a single metric it is designed to resist being gamed by any one number moving on its own.
The appeal is obvious: one line on a dashboard that goes up when things are going well. The catch is equally obvious once you have used one for a quarter: a composite number tells you that something moved without telling you what, and the temptation to report the headline without the breakdown is strong precisely because the headline is so easy to read.
Use it as a thermometer, not a diagnosis. PES is good at telling you that this segment is warmer than that one, or that this quarter is cooler than last. It is not designed to tell you why, and no amount of tuning will make it do so. The diagnosis lives in the components and in the cohort table underneath them.
The Product Engagement Score Formula
Three percentages, one mean. The simplicity is the point: it keeps the score explainable in a sentence, which is the only reason anyone outside the product team will ever trust it. What varies between companies is not the arithmetic but the definitions inside each component, and that is where all the real decisions are.
Breadth: how much of the product's core value each account actually reaches. Usually the share of your defined core features that an account has used in the period.
features used ÷ core features tracked
Frequency: how often users return. Normally DAU/MAU, or WAU/MAU for products with a weekly rhythm rather than a daily one.
daily actives ÷ monthly actives
Expansion: whether usage is spreading rather than shrinking. Typically the net change in active users, seats or accounts across the period.
(new + resurrected − churned) ÷ start actives
Each of these has a full guide of its own, and it is worth reading them before you finalise definitions: our feature adoption guide covers how to pick which features count as core, and product stickiness covers why DAU/MAU behaves so differently between daily and weekly products.
Two definitional traps. First, adoption is only as honest as your list of core features: adding rarely-used features to the list will drop the score, and quietly removing them will raise it, with no change in behaviour whatsoever. Second, DAU/MAU is structurally low for products people are supposed to use weekly; if that is you, use WAU/MAU and say so, rather than reporting a stickiness of 12% forever and calling it a problem.
A Worked Example
Take a B2B analytics product that has defined six core features, is used on a weekly rhythm, and measures growth in monthly active users. For the last month:
| Component | Raw figures | Calculation | Value |
|---|---|---|---|
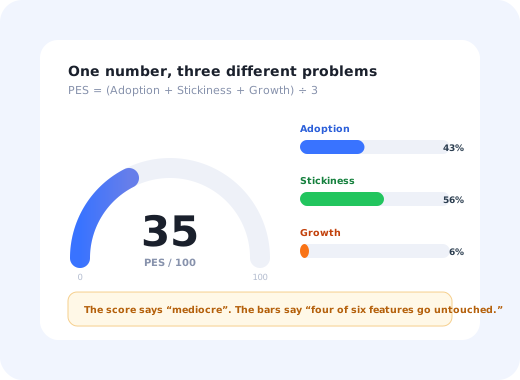
| Adoption | Accounts use an average of 2.6 of 6 core features | 2.6 ÷ 6 | 43% |
| Stickiness | 4,100 weekly actives, 7,300 monthly actives | 4,100 ÷ 7,300 | 56% |
| Growth | Started at 6,900 actives; +980 new and resurrected, −580 churned | (980 − 580) ÷ 6,900 | 6% |
| PES | (43 + 56 + 6) ÷ 3 | 35 |
Now look at what the single number did to that picture. A PES of 35 reads as mediocre, but the story underneath is a product with respectable frequency, a real breadth problem, and growth that is positive but thin. Report 35 and you will get a conversation about "engagement". Report the three bars and you will get a conversation about why four of six core features go untouched, which is a problem someone can actually be assigned.
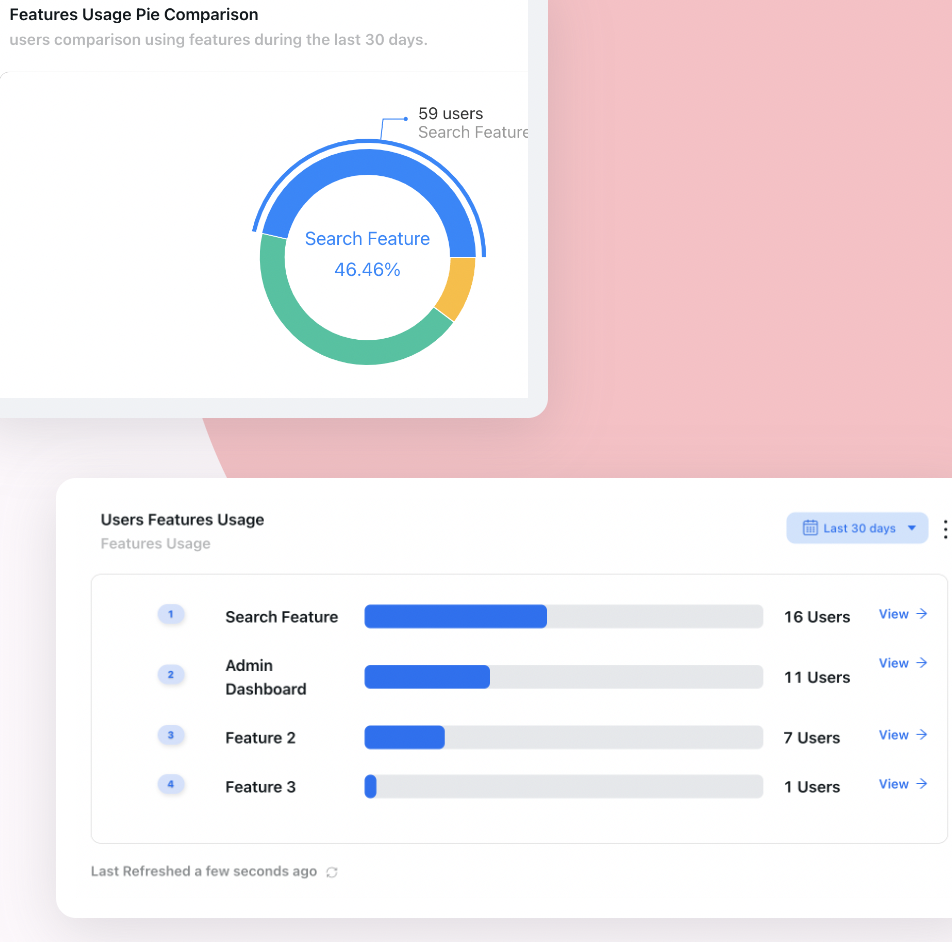
The adoption component is only as good as your view of which features are genuinely being used.
Weighting, Segmenting and Versioning the Score
An equal-weighted mean is the right place to start and rarely the right place to stay. Three adjustments make the score more useful without making it less explainable.
1. Weight by what predicts retention in your product
If your own analysis shows that accounts using four or more core features renew far more reliably than accounts that log in daily, then adoption deserves more than a third of the score. Derive the weights from a retention comparison rather than from intuition, write them into the definition, and expect to revisit them once a year at most. A weighted version simply becomes PES = (w₁·A + w₂·S + w₃·G) with weights summing to one.
2. Segment before you compare
A single company-wide PES averages your most engaged accounts with the ones that stopped logging in months ago, producing a number that describes nobody. Calculate it per plan, per role, per segment and, in B2B, per account, and the same three components suddenly become actionable. The gap between your top and bottom quartile is usually more informative than the overall figure.
3. Version the definition
Any change to the core-feature list, the stickiness ratio or the weights breaks comparability with every previous period. Treat the definition like a schema: give it a version number, note the date it changed, and mark that date on the chart. Teams that skip this end up arguing about whether last March was better than this March when the two numbers were never measuring the same thing.
PES vs the Other Numbers on Your Dashboard
The most common confusion is between PES and a customer health score. They overlap, they are built from different material, and they answer different questions.
| What it measures | Built from | Best question it answers | |
|---|---|---|---|
| Product engagement score | Breadth, frequency and spread of product usage | Product events only | Is the product being used more or less than it was? |
| Customer health score | Likelihood the relationship continues | Usage plus tickets, invoices, sentiment, contract data | Which accounts need attention before renewal? |
| NPS | Stated willingness to recommend | A survey question | How do users feel about us right now? |
| DAU/MAU | Frequency alone | Two active-user counts | Has the product become part of a routine? |
| North star metric | Delivered customer value | One chosen value event | Are we creating more of the thing users came for? |
In a mature setup PES is usually an input to the health score rather than a rival to it, and both sit underneath the north star. If you only have the appetite to maintain one composite, maintain the health score for account management and keep the three PES components visible separately for the product team; you lose almost nothing.
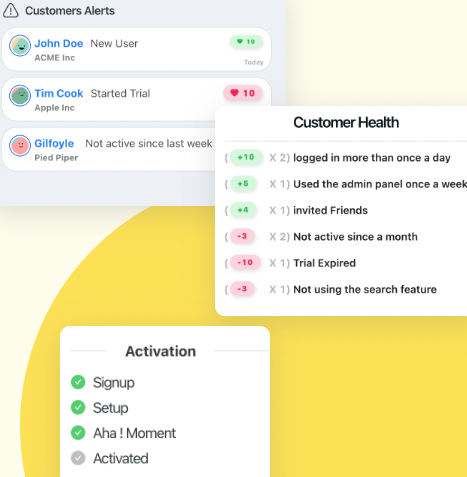
Engagement scoring and health scoring answer different questions: the first about the product, the second about the relationship.
How to Move Each Component
This is where a composite score earns or wastes its keep. "Improve engagement" is not a task. "Get the second and third core features in front of accounts that only ever use the first" is.
1. Adoption: fix discovery, not the feature
Unused features are usually undiscovered rather than unwanted, and the gap is almost always at the moment of relevance rather than at signup. The changes that work are contextual: a hotspot on the control that opens the unused capability, a short walkthrough triggered when someone reaches the screen where it would have helped, an in-app announcement shown only to accounts that have never touched it. Our feature discovery guide covers the sequencing; the point for PES is that adoption is the component that responds fastest to in-app work.
2. Stickiness: attach to a rhythm that already exists
Frequency rises when the product becomes part of a recurring job (the Monday review, the end-of- sprint report, the weekly reconciliation) and it does not rise because you sent more email. Find the recurring workflow your product could own, then make the return trip trivially easy: a saved view, a scheduled digest, a trigger that brings the right person back at the right moment. If nothing in your product recurs naturally, stickiness is the wrong component to be optimising and you should weight it lower.
3. Growth: onboard the second wave deliberately
In B2B, growth inside an account almost always means colleagues of the original champion. Those people were not in the sales cycle, did not choose the tool, and typically receive a login and no context at all, so they arrive at a product configured for someone else's job. A role-aware first session for invited users, rather than the one written for the buyer, is the highest-leverage change available here; our personalised onboarding guide covers how to branch it without building three products.
Five Ways a PES Goes Wrong
- Reporting the headline alone. The single most common failure. A stable 41 can hide adoption climbing six points while stickiness falls six, a real change presented as no change at all.
- Quietly redefining the core-feature list. Adding or removing tracked features shifts the score without shifting behaviour. If the list changes, the version changes and the chart gets a marker.
- Chasing someone else's benchmark. A PES from another company is a number produced by different definitions on a product with a different natural frequency. It is not a target.
- One score for every segment. Averaging trials with enterprise accounts, or admins with occasional viewers, produces a figure that describes no real user.
- Watching it daily. Two of the three components need a full period to stabilise. A daily PES is mostly noise, and reacting to noise costs more than ignoring the metric entirely.
Product Engagement Score: Do vs. Don't
✅ Do
- Write the definition down, with a version number and a date
- Always display the three components alongside the score
- Calculate it per segment, and in B2B per account
- Derive weights from your own retention evidence
- Use WAU/MAU if your product has a weekly rhythm
- Review it monthly, next to the qualitative signals
❌ Don't
- Compare your score with another company's
- Change the core-feature list without marking the chart
- Set an OKR on the composite instead of on a component
- Count logins as adoption
- Let a rising score end a conversation that a component would have started
- Treat a low score as a verdict rather than a question
Building It Without a Data Team
Everything above needs two things: reliable events for the actions that count as core, and the ability to act on what the score reveals without waiting for a release. The first is an event taxonomy problem and worth doing properly once. The second is where most teams stall: the analysis says "accounts on the starter plan never reach the third core feature", and the fix sits behind a engineering queue for a quarter.
In-app guidance closes that gap. A tooltip on the control nobody finds, a checklist that sequences the first three core actions, a walkthrough that only appears for accounts missing a specific feature: each is a targeted intervention against one component of the score, publishable to one segment, and measurable in the next period. That is what turns a dashboard number into a work item.
Move adoption without waiting for a release
Kompassify lets you put contextual tooltips, checklists, walkthroughs and in-app announcements on top of your existing product, targeted to the exact segment that is missing a feature, with step-by-step analytics on what each guide achieved. Free up to 100 monthly active users, plans from $129/month, GDPR-compliant and EU-hosted.
Start for free →The One-Paragraph Version
A product engagement score averages adoption, stickiness and growth into one number out of 100, which makes it an excellent trend line and a terrible explanation. Define each component precisely, version the definition, segment the score, never publish it without the breakdown, and treat each component as a separate piece of work, because that is the level at which anything about engagement can actually be changed.
Frequently Asked Questions
What is a product engagement score?
A product engagement score, usually shortened to PES, is a composite index that combines several usage metrics into a single number between 0 and 100 so that engagement can be tracked over time and compared between accounts. The common formulation averages three components: adoption (how much of the product's core value is being used), stickiness (how often users come back), and growth (whether usage is expanding within the account). It is not a standard with an official definition: it is a convention, and the version that matters is the one you define and document for your own product.
What is the product engagement score formula?
The usual formula is PES = (Adoption + Stickiness + Growth) / 3, where each component is expressed as a percentage. Adoption is typically the share of core features an account actually uses, stickiness is DAU/MAU or its weekly equivalent, and growth is the change in active users or accounts over the period. Because it is an unweighted mean of three percentages, the result sits between 0 and 100 and moves slowly, which is what makes it usable as a trend line and useless as an alert.
What is a good product engagement score?
There is no universal benchmark, and any number quoted as one should be treated with suspicion, because PES depends entirely on how you defined its three components. A product that counts eight core features will score lower than one that counts three, and a weekly-use product will always look worse on DAU/MAU than a daily one. The only meaningful comparisons are internal: this quarter against last, this segment against that one, accounts that renewed against accounts that churned. Set your own baseline first, then judge movement against it.
What is the difference between PES and a customer health score?
PES only looks at product usage, while a customer health score also folds in non-product signals such as support tickets, invoice status, NPS responses, sponsor changes and contract data. In practice PES is often one input into the health score rather than a competitor to it: engagement tells you how the product is being used, health tells you whether the relationship is likely to renew. Teams that maintain both use PES for product decisions and the health score for account decisions.
Should you weight the three components equally?
Start equal, then change the weights only when you can justify it with evidence. If your own retention analysis shows that breadth of feature use predicts renewal far better than daily frequency does, weighting adoption higher makes the score more decision-useful. What matters more than the weights is that they are written down, applied consistently, and versioned: a score whose definition quietly changes is worse than no score, because trend comparisons across the change become meaningless.
How often should you calculate PES?
Monthly for most B2B products, weekly only if you have enough volume that a week is not mostly noise. The score contains a stickiness ratio and a growth term, both of which need a reasonable window to stabilise, so calculating it daily produces a jittery line that invites over-reaction. Review it on the same cadence as your business reviews and always alongside the three components separately, never as a single headline figure.
What are the drawbacks of a product engagement score?
Compression. Averaging three percentages means a rise in one can conceal a fall in another, so a flat PES is compatible with adoption climbing while stickiness collapses. It is also gameable: adding more tracked features or redefining the core set changes the number without changing user behaviour, and it says nothing about why anything moved. Treat it as a dashboard headline that prompts a question, and keep the component breakdown next to it so the question can be answered.
How do you improve a product engagement score?
Work on one component at a time, because each has a different lever. Adoption improves when users discover and successfully complete features they never reached: contextual guidance, checklists and in-product announcements at the moment of relevance. Stickiness improves when the product earns a place in a recurring workflow, usually by tying it to an existing rhythm rather than by sending more notifications. Growth improves when second-wave users inside an account are onboarded deliberately instead of being handed a login by their colleague.