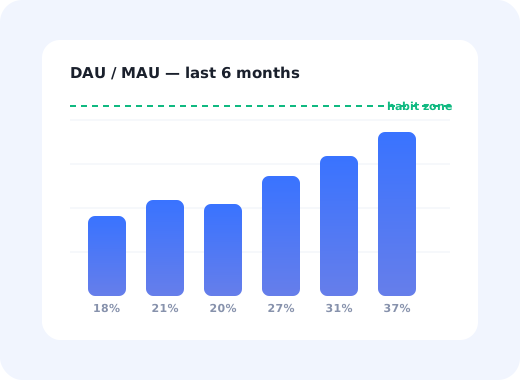
Two products have 10,000 monthly active users. In the first, 4,000 people open it every day. In the second, each user shows up once a month and disappears. The monthly number is identical. The businesses are not remotely alike.
Product stickiness is the metric that separates them. It asks a narrow, useful question: of the people who use your product in a month, what fraction use it on any given day?
This guide covers the stickiness definition, the DAU/MAU formula, what a good ratio looks like for different kinds of products, why the headline benchmark you have probably seen is misleading, and what actually moves the number.
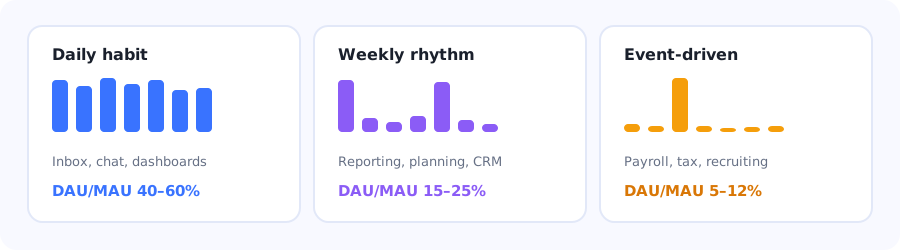
The same stickiness ratio means completely different things depending on how often your product is genuinely needed.
Key Takeaways
- Stickiness is DAU ÷ MAU. It measures usage frequency: how often the people who use your product come back.
- There is no universal good ratio. A weekly planning tool at 20% may be healthier than a chat tool at 30%.
- Compare against your product's natural rhythm. The right benchmark is the frequency the job actually demands, not an industry average.
- Stickiness can rise while the business shrinks. If casual users churn out, the ratio improves; always read it next to raw active-user counts.
- Habit is built at a trigger, not a feature. Products get sticky when they attach to something that already happens on a schedule.
- New users are where the ratio is won. Frequency habits form in the first two weeks or not at all.
What is product stickiness?
Product stickiness definition: a measure of how frequently users return to a product, most commonly expressed as the DAU/MAU ratio, daily active users divided by monthly active users. A stickiness of 30% means the average monthly user is active on roughly 9 days out of 30.
The useful mental model: stickiness converts your monthly user count into an attendance rate. It answers "how many days a month does a typical user show up?", which is a much better proxy for habit than any single count of users, sessions or clicks.
The DAU/MAU formula
Stickiness = (Daily Active Users ÷ Monthly Active Users) × 100
If you average 3,700 DAU across a month with 10,000 MAU, stickiness is 37%. Expressed as days: the average monthly user was active on about 11 days.
Two implementation details decide whether the number means anything:
- Use the average DAU across the month, not a single day's figure. One Tuesday tells you about that Tuesday.
- Define "active" as a meaningful action, not a page load. If a user opening an email notification counts as active, your stickiness measures your email cadence rather than your product.
Stickiness vs engagement vs retention
These three are constantly confused, and the distinction is genuinely simple:
| Metric | Question it answers | Time horizon |
|---|---|---|
| Stickiness | How often do users come back? | Within a month |
| Engagement | How deeply do they use it when they do? | Per session |
| Retention | Do they come back at all over time? | Weeks to months |
You can have high stickiness and terrible retention: a cohort that uses the product daily for three weeks and then vanishes entirely. That combination is common in products that solve a one-off project need, and it is invisible if you only watch the DAU/MAU ratio. Read stickiness alongside a retention curve, never instead of one.
What is a good stickiness ratio?
The number quoted everywhere is 20%. It is a reasonable rule of thumb and a terrible target, because it ignores the only thing that determines whether a ratio is good: how often your product is genuinely needed.
| Product rhythm | Examples of the job | Healthy DAU/MAU | Ceiling reality |
|---|---|---|---|
| Daily habit | Messaging, inboxes, live dashboards, dev tools | 40–60% | Anything under 25% signals a real problem. |
| Workday tool | Project management, support desks, design tools | 25–40% | Weekends structurally cap the ratio near 70%. |
| Weekly rhythm | Reporting, pipeline reviews, content planning | 15–25% | 20% is already close to the theoretical max. |
| Periodic / event-driven | Payroll, tax, recruiting, invoicing, benefits | 5–12% | Chasing a higher ratio here means adding busywork. |
Do not optimise stickiness past your product's natural frequency. A payroll tool used twice a month is not unhealthy at 8%; it is correctly shaped. Teams that treat 20% as a universal target end up bolting on notifications, streaks and dashboards that manufacture visits without creating value. The ratio improves and the product gets worse.
The comparison that actually matters
Instead of benchmarking against other companies, benchmark against yourself in three ways:
- Your own trend over six to twelve months, with a note of what shipped when.
- Your best cohort: the stickiness of your most successful segment shows you the realistic ceiling for the rest.
- Your renewing accounts vs your churned ones. If both had the same stickiness, the metric is not predictive for you and you should stop reporting it as if it were.
Why the stickiness ratio lies to you
DAU/MAU is a ratio, and ratios move for two reasons. Before you celebrate a rise, check which one it was.
1. The denominator collapsed
If casual users churn out, MAU falls, and stickiness rises even though the business just got smaller. This is the single most common misreading of the metric. Always chart stickiness with DAU and MAU on the same screen. A ratio improving while both absolute numbers fall is a shrinking core, not a stickier product.
2. It hides who is actually sticky
A blended 25% might be 8% of your users at 90% and everyone else at 5%. That is not a sticky product; that is a small group of power users carrying an average. Segment stickiness by plan, role, company size and tenure before drawing any conclusion. The gap between your best and worst segment is usually more actionable than the average itself.
3. "Active" is doing too much work
Every stickiness number depends entirely on your definition of an active user, and most definitions are far too generous. A user who opened the app, saw a loading spinner and closed it is not active in any sense that matters. Define active as completing a core action, the thing your product exists to do, and expect your ratio to drop when you fix the definition. That drop is progress.
4. Weekly rhythms make it noisy
B2B products have brutal weekend troughs. Comparing a month with five Mondays to one with four produces movement that has nothing to do with your product. For B2B, many teams get a cleaner signal from WAU/MAU, which smooths the weekly cycle out entirely.
How to actually increase product stickiness
Stickiness is a symptom. You cannot raise it directly; you raise it by making the product a natural part of something users already do on a schedule.
Find the trigger your product should attach to
Get users to the second session, not just the first
Widen the number of jobs the product does
Make returning cheaper than starting over
Give users a reason that is not a notification
1. Find the trigger your product should attach to
Habits form around existing routines, not around features. The question is not "how do we get users to come back daily?" but "what already happens daily in this person's job that our product should be part of?": the morning standup, the moment a support ticket arrives, the end-of-day handover.
Look at your most frequent users and find what they have in common in when they open the product, not what they click once inside. That timing pattern is the trigger you should be designing around for everyone else. A user journey map built from real session timing rather than assumptions is the fastest way to find it.
2. Get users to the second session, not just the first
Frequency habits are set in the first two weeks. A user who completes setup, gets value once and does not return within a few days almost never becomes a daily user later. This makes stickiness an activation problem far more than a re-engagement problem.
Concretely: shorten time to value, and make sure the first session ends with something that creates a reason to return: data saved, a teammate invited, an alert configured, a recurring report scheduled. A first session that ends in a completed task and nothing else has no hook.
3. Widen the number of jobs the product does
Frequency is often just breadth in disguise. A user who uses your product for one task will use it as often as that task occurs. A user who uses it for three will show up more or less by arithmetic.
This is where feature discovery pays off directly. Users rarely go looking for capabilities they do not know exist; a contextual tooltip or a well-timed tour of an adjacent feature, shown to users who have mastered the first one, is one of the few reliable ways to widen usage without adding noise.
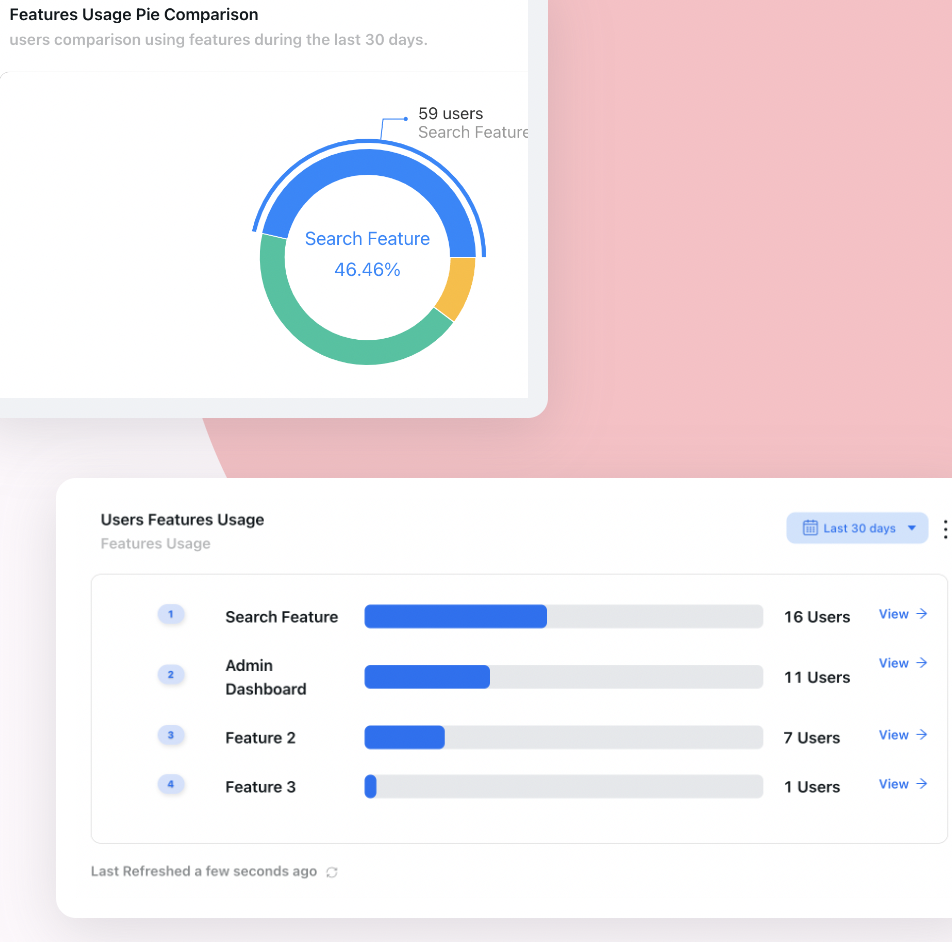
Breadth of feature use is what turns a monthly visitor into a weekly one; measure it before you try to raise frequency.
4. Make returning cheaper than starting over
Every unit of accumulated state (saved views, templates, connected data, invited teammates, configured alerts) makes the next visit easier and the alternative more expensive. Products that ask users to reconstruct context on every visit do not become habits, regardless of how good the core feature is.
5. Give users a reason that is not a notification
Notifications can manufacture a visit, but a visit with no payoff trains users to ignore the next one. The durable version is a product state that changes on its own and is worth checking: new data arriving, teammates acting, thresholds crossing. If nothing in your product changes while the user is away, no amount of messaging will make it a daily habit.
Where you do reach out in-app, make it specific and dismissible; an announcement about something that actually happened in their account beats a generic "come back" every time.
Reading stickiness without fooling yourself
✅ Do
- Use average DAU across the whole month
- Define "active" as a core action
- Chart DAU, MAU and the ratio together
- Segment by plan, role and tenure
- Benchmark against your own best cohort
- Use WAU/MAU for B2B products
- Read it next to a retention curve
- Judge the ratio against your product's natural rhythm
❌ Don't
- Treat 20% as a universal target
- Count a page load as "active"
- Celebrate a rise caused by churned casual users
- Report a blended average with no segments
- Compare against unrelated categories
- Manufacture visits with streaks and badges
- Use a single day's DAU
- Optimise past the frequency the job requires
Tracking and improving stickiness with Kompassify
Measuring stickiness properly needs event-level data: which core actions users complete, how often, and in which segment. Improving it needs the ability to intervene in the product at the right moment. Kompassify does both without code.
- Track core actions, not page views, so your active-user definition reflects real value.
- Segment usage frequency by plan, role and tenure to find where the ratio is really coming from.
- Trigger tours and tooltips on adjacent features for users who have mastered their first workflow, widening breadth of use.
- Use onboarding checklists that end with a return-creating action: a teammate invited, an alert set, a report scheduled.
- Announce real changes in the account through the announcement widget rather than generic re-engagement nudges.
Kompassify is a no-code digital adoption platform for SaaS teams, free up to 100 monthly active users, with paid plans from $129/month and GDPR-compliant EU hosting. See product analytics for what it measures out of the box.
Turn one-off users into a weekly habit
Track the actions that define an active user, then guide people to the second and third workflow that make coming back automatic.
Start for Free →Frequently Asked Questions
What is product stickiness?
Product stickiness measures how frequently users return to a product. It is most commonly expressed as the DAU/MAU ratio: daily active users divided by monthly active users. A stickiness of 30% means the average monthly user is active on roughly 9 days out of 30. It converts a raw user count into an attendance rate, which is a much better proxy for habit than session or click counts.
How do you calculate the DAU/MAU ratio?
Divide average daily active users across the month by monthly active users, then multiply by 100. If you average 3,700 DAU against 10,000 MAU, stickiness is 37%. Two details matter: use the average DAU across the whole month rather than a single day, and define active as completing a meaningful core action rather than simply loading a page.
What is a good DAU/MAU ratio?
It depends entirely on how often your product is genuinely needed. Daily-habit products like messaging and dev tools are healthy at 40-60%. Workday tools such as project management sit at 25-40%. Weekly-rhythm products like reporting and planning tools are fine at 15-25%. Periodic products like payroll or tax software are correctly shaped at 5-12%. The widely quoted 20% benchmark is a rough rule of thumb, not a target.
What is the difference between stickiness, engagement and retention?
Stickiness asks how often users come back within a month. Engagement asks how deeply they use the product when they are there. Retention asks whether they come back at all over weeks and months. They can diverge sharply: a cohort can use a product daily for three weeks and then vanish, which looks excellent on stickiness and terrible on retention. Always read the two together.
Can product stickiness be misleading?
Yes, in four ways. The ratio rises when casual users churn out because the denominator shrinks, so a rising ratio can accompany a shrinking business. A blended average can hide a small group of power users carrying everyone else. A loose definition of active inflates the number. And weekly rhythms in B2B products create month-to-month noise that has nothing to do with the product, which is why WAU/MAU is often a cleaner signal for B2B.
How do you increase product stickiness?
Attach the product to a routine that already happens on a schedule rather than trying to manufacture visits. Focus on the first two weeks, since frequency habits form there or not at all, and make sure the first session ends with something that creates a reason to return, such as saved data, an invited teammate or a scheduled report. Widen the number of jobs the product does, because breadth of use drives frequency almost arithmetically. And accumulate state so returning is cheaper than starting over.
Should I use DAU/MAU or WAU/MAU?
For consumer and daily-habit products, DAU/MAU is the right ratio. For most B2B software, WAU/MAU is more informative because it smooths out weekend troughs and the noise created by months with different numbers of working days. If your product is used on a weekly rhythm by design, DAU/MAU will look artificially poor and will tempt you into changes that add busywork rather than value.
Is a low stickiness score always a problem?
No. A product that is genuinely needed twice a month is not unhealthy at 8% stickiness, it is correctly shaped. The failure mode to avoid is treating a universal benchmark as a target and then bolting on streaks, badges and notifications to manufacture visits. That raises the ratio while making the product worse. Judge stickiness against the frequency the underlying job actually demands.