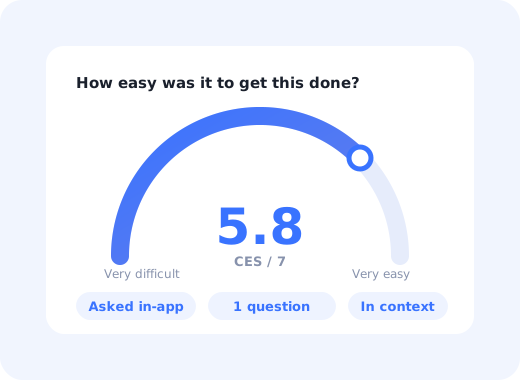
Every SaaS team has a metric that tells them whether users are happy. Very few have one that tells them whether users are tired. That gap matters, because the customers who churn are rarely the ones who hated your product; they are the ones who found it exhausting.
Customer Effort Score is the metric built for exactly that problem. It asks one question, at one moment, about one thing: how hard did the user have to work to get what they came for?
This guide covers what CES is, how the score is calculated, what counts as a good number, where CES fits alongside CSAT and NPS, and, most importantly, what to actually change once the score comes back low.
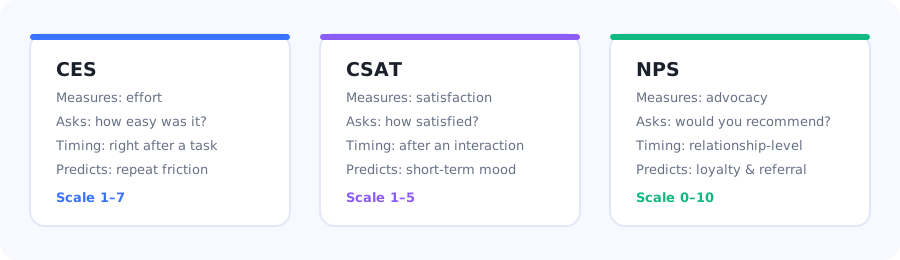
CES, CSAT and NPS answer different questions; running all three is not redundant.
Key Takeaways
- CES measures effort, not emotion. It asks how easy a specific task was, which makes it far more actionable than a general satisfaction rating.
- Effort predicts churn better than delight predicts loyalty. Customers rarely leave because you failed to amaze them. They leave because a routine task kept being harder than it needed to be.
- Timing is the whole game. A CES survey fired more than a few minutes after the task is a memory test, not a measurement.
- One question, in-app, in context. The moment you add a second question you are no longer measuring effort; you are measuring patience.
- The follow-up is where the value is. The number tells you there is friction; the open-text answer tells you where.
- Segment before you conclude. A healthy average CES can hide a brutal score for new users in their first week.
What is Customer Effort Score?
Customer Effort Score (CES) definition: a single-question survey metric that measures how much effort a customer had to expend to complete a specific task: signing up, finding a setting, resolving a support issue, or finishing a workflow. It is usually collected on a 1–7 agreement scale immediately after the task, and reported as the average of all responses.
The modern phrasing is a statement the user agrees or disagrees with:
"[Company] made it easy for me to handle my issue." 1 = strongly disagree, 7 = strongly agree.
The older phrasing asked "how much effort did you personally have to put forth?" on a reversed scale, where a low score was good. That version caused endless confusion in reporting, so most teams have moved to the agreement version where higher is better. Pick one, write it down, and never quietly switch; a mid-year change in scale direction will make a year of trend data meaningless.
Why effort is the signal worth tracking
The insight behind CES is uncomfortable: exceeding customer expectations is expensive and does surprisingly little for loyalty, while failing to make things easy is cheap to do and devastating. A user who has to open a support ticket to change a billing address, or click through four screens to export a report they run weekly, is not angry. They are accumulating quiet reasons to evaluate an alternative at renewal.
That is also why CES pairs so well with onboarding work. Most of what a good onboarding programme does (product tours, checklists, contextual tooltips) exists to reduce effort. CES is the number that tells you whether it worked.
How to calculate Customer Effort Score
The standard calculation is a straight average:
CES = (sum of all responses) ÷ (number of responses)
If 120 users respond and their ratings total 684, your CES is 684 ÷ 120 = 5.7 out of 7.
The alternative: percentage of "easy" responses
Some teams prefer to report the share of respondents who answered 5, 6 or 7, the "top-three-box" percentage. This is easier for non-analysts to read ("82% of users said it was easy") and it is less distorted by a handful of furious 1s. The trade-off is that it hides movement inside the top box: a product improving from a wall of 5s to a wall of 7s will show no change at all.
Report the average as your headline number and the top-three-box percentage as a secondary, and you get both the sensitivity and the readability.
What counts as a good CES?
| Average CES (1–7) | Reading | What to do |
|---|---|---|
| 6.0 – 7.0 | The task is genuinely effortless | Protect it. Add this flow to your regression checklist so a redesign does not quietly break it. |
| 5.0 – 5.9 | Acceptable, with a friction pocket somewhere | Read the open-text answers. There is usually one specific step dragging the average down. |
| 4.0 – 4.9 | Users are working around your design | Watch session behaviour on the flow. Expect support tickets and abandoned attempts. |
| Below 4.0 | The task is a churn risk in its own right | Treat it as a bug, not a UX preference. Fix the flow before you invest in anything downstream. |
Be careful with published "industry averages". CES is scale-dependent, wording-dependent and task-dependent, so a benchmark collected from support-ticket surveys tells you almost nothing about your in-product export flow. Your own trend line is the only benchmark worth acting on.
CES vs CSAT vs NPS: which one answers which question
These three metrics get treated as interchangeable, and they are not. Each measures a different thing at a different altitude.
| CES | CSAT | NPS | |
|---|---|---|---|
| Question | How easy was it? | How satisfied are you? | Would you recommend us? |
| Scope | One specific task | One interaction or feature | The whole relationship |
| Best trigger | Immediately after task completion | Shortly after an interaction | Periodically, after real usage |
| Tells you | Where friction lives | Whether users liked it | Whether users would vouch for you |
| Weakness | Blind to value: an easy but useless flow scores well | Vague; hard to act on | Lagging; slow to move |
The practical arrangement most product teams land on: CES on individual flows (onboarding, first export, first invite, support resolution), CSAT on features, and NPS on the account, quarterly. Running all three is not redundant as long as each one is attached to the right moment.
When to trigger a CES survey
CES is the most timing-sensitive of the common survey metrics. Effort is a feeling that evaporates: ask someone twenty minutes after they finished a task and they will report how they feel about your product in general, which is precisely what CES is supposed to avoid.
Immediately after the user completes the task you care about
Immediately after a support conversation is resolved
At the end of an onboarding flow or setup wizard
After the first successful use of a newly launched feature
After a self-service action that used to require your team
1. Right after task completion
The canonical trigger. Fire it on the success state: the confirmation screen, the "report exported" toast, the moment the integration turns green. If your product has an aha moment, that is the single highest-value place to measure effort, because effort spent before the aha moment is effort users have not yet been paid back for.
2. Right after a support resolution
The original home of CES. Ask when the ticket closes, not in a weekly digest. Pair the score with the ticket category and you get a ranked list of the flows your product is failing to explain on its own, which is a roadmap for in-app support.
3. At the end of onboarding
A CES prompt on the last step of setup is one of the cheapest diagnostics in SaaS. If the score is high but activation is low, your onboarding is pleasant but pointless. If the score is low and activation is low, you have a friction problem you can locate step by step.
4. After the first use of a new feature
Newly shipped features carry unexamined assumptions. A CES prompt on first use catches the ones that only reveal themselves outside the design review, and it catches them in the week you announced the feature, not in the quarterly review.
5. After a self-service action
Every task you move from "email support" to "do it yourself" should be CES-tested. Self-service that is technically possible but practically miserable generates more resentment than no self-service at all.
Do not survey the same user on every task. Cap CES prompts to roughly one per user per month, exclude anyone who answered in the last 30 days, and never stack a CES prompt on top of an NPS prompt in the same session. Survey fatigue does not just lower your response rate; it biases it toward the people who are still willing to be interrupted.
How to write a CES question that works
Name the task, not the company
"Kompassify made it easy for me to do what I needed" is vague enough that users answer about the product overall. "It was easy to set up my first product tour" is a measurement. Reference the specific thing they just finished.
Keep it to one question on screen
The rating first. The optional open-text follow-up appears after they answer, not beside it. This is the difference between a 40% response rate and a 12% one.
Make the follow-up conditional
Branch on the score. Low scores get "What made it difficult?". High scores get "What worked well?" or nothing at all. A single generic "Any comments?" box wastes the one chance you have to ask a precise question.
Label both ends of the scale
Numbers without anchors get interpreted inconsistently, and the inconsistency is not random; it correlates with how experienced the user is. Label 1 and 7 explicitly, every time.
Let people dismiss it
A survey the user cannot close is a survey that gets a random answer. An honest dismissal is better data than a coerced 4. This is basic microcopy and UX hygiene, and it protects the credibility of every survey you run afterwards.
What to do with a low CES
A score on a dashboard changes nothing. The work is in the loop that turns a number into a shipped fix.
1. Locate the step, not the flow
"Onboarding scored 4.1" is not a finding. Break the flow into steps, look at where users drop, and read the verbatims attached to the low scores. Nearly always, one step is carrying most of the damage: a permission request that arrives too early, a field that demands information the user does not have yet, an empty screen with no next action.
2. Decide whether it is a product fix or a guidance fix
Some friction is real complexity that has to be removed in the product. Some friction is a user who does not know what to do next. The second kind is far cheaper to fix: a well-placed tooltip, a better empty state, or a short walkthrough will move the score within days. Guidance is not a substitute for good design, but it is the right first response when the underlying flow is sound and only the path through it is unclear.
3. Segment before you generalise
Split CES by tenure, plan, role and user segment. The most common pattern by far: experienced users report 6.5, first-week users report 3.8, and the blended average of 5.6 looks fine on the dashboard while your trial conversion quietly suffers.
4. Close the loop with the people who complained
When you ship the fix, tell the users who reported the friction. An in-app announcement targeted at the segment that scored low does two things at once: it recovers goodwill, and it trains users that answering your surveys has consequences, which is the only durable way to keep response rates up.
5. Re-measure the same way
Same wording, same scale, same trigger point. If you change the question when you change the flow, you have lost the ability to prove the fix worked.
CES mistakes that quietly ruin the data
✅ Do
- Trigger immediately after the specific task
- Name the task in the question wording
- Show one question at a time
- Branch the follow-up on the score
- Label both ends of the scale
- Segment by tenure, plan and role
- Track the trend, not the absolute number
- Tell users what you changed
❌ Don't
- Send CES by email days later
- Ask about "your experience with us" in general
- Stack CES on top of an NPS prompt
- Flip the scale direction mid-year
- Compare your score to an unrelated benchmark
- Survey the same users repeatedly
- Report a blended average with no segments
- Collect scores you have no plan to act on
The blind spot to watch for: CES is silent on value. A flow can be effortless and still be worthless; nobody struggles with a feature they never open. Always read CES next to adoption and retention data. Effortless and unused is a product problem no survey will surface on its own.
Running CES inside your product with Kompassify
CES only works when it is asked in-app, in context, at the exact moment a task finishes, which is exactly what an in-app survey tool is for. With Kompassify you can build a one-question CES survey without code, trigger it on the completion of a specific flow, target it to a segment, and read the results next to the adoption data for the same feature.
- Trigger on behaviour, not on time. Fire the prompt when the user reaches the success state of the flow you are measuring.
- Target a segment. First-week users, a single plan tier, or only users who completed the flow without opening a support ticket.
- Branch the follow-up. Ask "what made it difficult?" only to the users who said it was difficult.
- Respect frequency caps. Show once, and exclude users who have seen another survey recently.
- Read it alongside product analytics. A CES number is a hypothesis; the drop-off data tells you which step to open first.
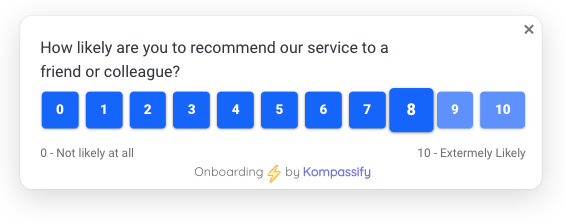
One question, shown in-app, at the end of the flow: the format a CES survey needs.
Kompassify is a no-code digital adoption platform for SaaS teams: product tours, onboarding checklists, tooltips, announcements, in-app surveys and product analytics in one place. It is free up to 100 monthly active users, paid plans start at $129/month, and it is GDPR-compliant with EU hosting.
Measure effort where it actually happens
Build a one-question CES survey, trigger it at the end of any flow, and see the friction before it turns into churn, no code required.
Start for Free →Frequently Asked Questions
What is Customer Effort Score?
Customer Effort Score (CES) is a single-question survey metric that measures how much effort a customer had to expend to complete a specific task, such as finishing setup, exporting a report, or resolving a support issue. It is normally collected on a 1-7 agreement scale immediately after the task and reported as the average of all responses. Unlike satisfaction metrics, CES is deliberately scoped to one action, which is what makes it actionable.
How do you calculate Customer Effort Score?
Add up all the responses and divide by the number of responses. If 120 users respond and their ratings total 684, the CES is 684 divided by 120, which is 5.7 out of 7. Many teams also report the top-three-box percentage, the share of respondents who answered 5, 6 or 7, because it is easier for non-analysts to interpret. Use the average as the headline number and the percentage as a secondary reading.
What is a good Customer Effort Score?
On a 1-7 scale where higher is better, 6.0 and above means the task is genuinely effortless, 5.0 to 5.9 is acceptable with a friction pocket somewhere in the flow, 4.0 to 4.9 means users are working around your design, and below 4.0 means the task is a churn risk in its own right. Published industry benchmarks are unreliable because CES depends heavily on wording, scale and the specific task, so your own trend line is the benchmark that matters.
What is the difference between CES, CSAT and NPS?
CES measures effort on one specific task and is triggered immediately after completion. CSAT measures satisfaction with an interaction or feature. NPS measures advocacy at the level of the whole relationship and is surveyed periodically. They are not interchangeable: CES tells you where friction lives, CSAT tells you whether users liked something, and NPS tells you whether they would vouch for you. Running all three is reasonable as long as each is attached to the right moment.
When should I trigger a CES survey?
Trigger it immediately after the moment you want to measure: the completion screen of a flow, the resolution of a support ticket, the last step of onboarding, the first successful use of a new feature, or a self-service action that used to require your team. CES is highly timing-sensitive because the feeling of effort fades quickly. A survey sent by email the next day measures general product sentiment, not effort.
How often should I send CES surveys to the same user?
Cap it at roughly one CES prompt per user per month, exclude anyone who has answered a survey in the last 30 days, and never stack a CES prompt on top of an NPS prompt in the same session. Over-surveying does not only reduce your response rate, it biases the responses toward the users who are still willing to be interrupted, which is not a representative group.
What should I do when CES comes back low?
Break the flow into steps and find the specific step carrying the damage rather than treating the whole flow as broken. Then decide whether it is a product problem or a guidance problem: real complexity has to be removed in the product, but a user who simply does not know what to do next can often be helped with a tooltip, a better empty state, or a short walkthrough. Segment the results by tenure and plan before drawing conclusions, ship the fix, tell the users who reported the friction, and re-measure with exactly the same wording and trigger.
Can CES be misleading?
Yes, in one specific way: CES is blind to value. A feature nobody uses will never generate friction, so an effortless flow can also be a worthless one. Always read CES next to adoption and retention data. A high CES on a feature with near-zero usage is not a success, it is a signal that the feature is not solving a problem users have.