There is a version of CSAT that tells you nothing. It is asked once a quarter, by email, about "your experience with us", to everyone at once. It comes back at 84%, as it did last quarter and the one before. Nobody can act on it, nobody quite trusts it, and it survives on the org chart because removing a customer metric looks bad.
There is another version that changes what a team builds next week. It is one question, asked thirty seconds after a specific thing happened, about that specific thing, and it comes back at 62% for the CSV importer and 91% for everything else. That version is not a different metric. It's the same formula, asked narrowly.
Customer Satisfaction Score is the simplest customer metric to calculate and the easiest to render meaningless through scope. This guide covers what CSAT measures, the formula with a worked example, how it differs from NPS and CES, which scale and wording to use, when to trigger it, what "good" means when benchmarks don't travel, the biases that inflate it, and eight ways to move it for real.
Key Takeaways
- CSAT = satisfied responses ÷ total responses × 100, counting the top two boxes on a five-point scale. Always publish the response count next to it.
- Narrow beats broad. "How satisfied were you with this import?" is actionable; "how satisfied are you with us?" is a mood that never moves.
- Ask immediately after the interaction: CSAT's whole value comes from the tightness of the link between the question and the moment.
- CSAT, NPS and CES are complements: satisfaction with a moment, loyalty over the relationship, effort on a task. Effort usually predicts churn best.
- Cross-industry benchmarks don't travel: scale, wording and timing all differ. Compare touchpoints inside your own product instead.
- The open follow-up is the deliverable. The score says something is wrong; the free-text answer says what, and it's what your next sprint is built from.
What Is CSAT? (Definition & Meaning)
CSAT, or Customer Satisfaction Score, measures how satisfied a person was with a specific interaction, feature or experience. It's collected with a single question and reported as the percentage of respondents who chose one of the top two satisfaction options.
CSAT, defined. A transactional satisfaction metric: one question, asked immediately after a defined interaction, reported as the share of respondents in the top two boxes. It measures a moment, not a relationship, and the narrower the moment, the more useful the number.
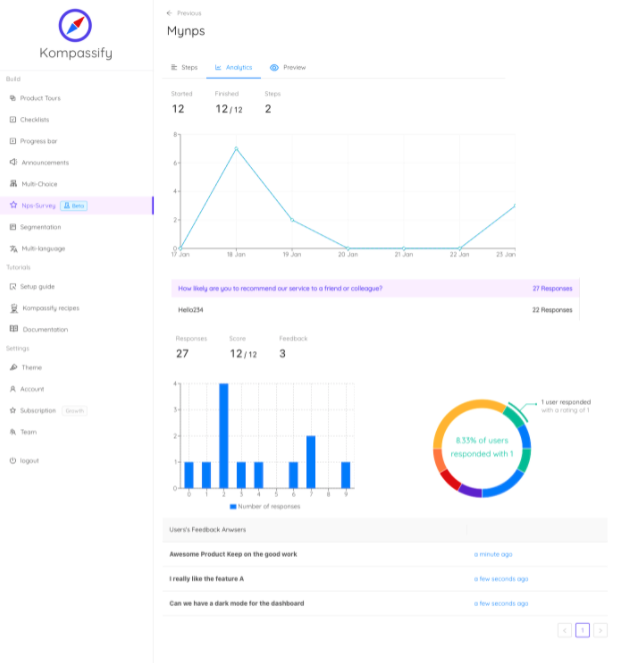
Here's what a well-formed CSAT survey looks like in a product: one question about one thing, answerable in a single click, with an optional follow-up that carries the actual insight:
Two design decisions are doing most of the work there. The question names a specific thing the user just did, so they don't have to average an entire relationship into one number. And the first interaction is a click rather than a text field, which is what makes the follow-up get typed at all: once someone has committed a click, writing a sentence feels like finishing rather than starting.
The CSAT Formula (With a Worked Example)
120 responses from 480 asked, a 25% response rate, which belongs in the report too
Three conventions decide whether your number means anything:
- Count the top two boxes only. Including the neutral middle option inflates every score and hides exactly the group you most want to understand, the people who were fine, which is not the same as satisfied.
- Report the response count and rate. A score without a denominator is unreadable. Nine responses at 89% and nine hundred at 71% are not comparable, and the first should never appear on a dashboard without its n.
- Keep the scale and wording frozen. Changing from five points to seven, or from "satisfied" to "happy", makes every historical comparison invalid. If you must change, run both for a period and say so.
CSAT vs NPS vs CES: Which One to Use When
| CSAT | NPS | CES | |
|---|---|---|---|
| Question | How satisfied were you with X? | How likely are you to recommend us? | How easy was it to do X? |
| Measures | One interaction | The whole relationship | Effort on a task |
| Scale | 1–5 | 0–10 | 1–7 agree/disagree |
| Asked | Right after the interaction | Periodically, on a rolling sample | Right after task completion |
| Best at | Pinpointing which touchpoint is weak | Trend lines and generating verbatims | Predicting churn and friction |
| Weakness | High scores can coexist with churn | Says little about why or where | Only meaningful per task |
The practical arrangement: run one relationship metric continuously on a rolling sample, usually NPS, and two or three transactional ones at the specific touchpoints where you have decisions pending. CSAT tells you which touchpoint is weak; CES tells you whether it's weak because it's hard; NPS tells you whether any of it is showing up in how people feel about you overall. Trying to make one metric do all three jobs is how organisations end up with a number nobody trusts.
Designing the Question: Scale, Wording, Timing
Use a five-point scale, consistently
Five points is the practical sweet spot: enough resolution to distinguish "fine" from "good", few enough that respondents don't deliberate. Three points loses the distinction that matters; ten points invites cultural response bias and gives you false precision. Whatever you choose, use it identically everywhere so touchpoints are comparable.
Label the endpoints, and consider faces
A bare 1–5 means different things to different people. Label the ends ("very dissatisfied" / "very satisfied"), and consider emoji or faces for in-product surveys: they're understood instantly, work across languages, and tend to lift response rates on small in-app cards.
Name the thing, not the company
"How satisfied were you with importing your data?" not "How satisfied are you with our product?" The narrower question is answerable without deliberation, produces a score attached to something you own, and can actually move when you fix that thing.
Keep the wording neutral
"How satisfied were you…" is neutral; "How much did you enjoy…" leads. Avoid double-barrelled questions ("how fast and accurate was the import?"): when the answer is "fast but wrong", a single number can't express it, so respondents guess and you learn nothing.
Ask immediately, in the product
The moment after the interaction, on the screen where it happened. Delay converts CSAT from measurement into recall, and every hour of delay costs both accuracy and responses. This is the core argument for running CSAT as an in-app survey rather than an email one.
Always add one open follow-up
"What's the main reason for your score?", optional, shown after the click. The score tells you a touchpoint is weak; only the free text tells you it's weak because the import silently drops rows with empty dates. That sentence is the deliverable; the percentage is just how you found it.
Where to Measure CSAT in a SaaS Product
Pick the touchpoints where you have a decision waiting, not the ones that are easy to instrument:
| Touchpoint | Trigger | What a low score usually means |
|---|---|---|
| Support conversation | On ticket resolution | Slow response, or the answer didn't actually solve it |
| Onboarding completion | After the last setup step | Setup was longer or harder than promised |
| A specific feature | Second or third use of it | It works but doesn't do the job people expected |
| Data import or integration | On completion, success or failure | Silent failures, unclear formats, no feedback |
| A newly shipped change | First use after release | The change solved your problem, not the user's |
| Documentation or in-app help | After an article or walkthrough | Content is stale or answers a different question |
Two or three of these running continuously will teach you more than a company-wide quarterly score ever has. And the comparison between them is where the insight lives: a product with 91% satisfaction everywhere except one importer has just been handed its roadmap.
Reading the Results Without Fooling Yourself
Response bias inflates almost every CSAT score
People who just had a good experience are more willing to answer; people who are quietly frustrated close the card. Assume your true satisfaction is somewhat below your measured score, watch the response rate as carefully as the score, and treat a rising score alongside a falling response rate as a warning rather than a win.
Segment before you conclude
An overall 72% might be 88% for admins and 54% for members, or 84% for users who completed onboarding and 41% for those who didn't. The aggregate averages away the group that needs help. Break every score down by segment and lifecycle stage before drawing a conclusion.
Small samples move for no reason
With thirty responses, a swing of several points is noise. Set a minimum response count before a touchpoint's score gets reported at all, and resist the temptation to explain movements that are statistically indistinguishable from randomness.
Read the verbatims, all of them, at first
For the first hundred responses per touchpoint, read every free-text answer. Then tag them into a small stable set of themes and track the tag counts. Rising themes are roadmap items with evidence attached; the score by itself has never told anyone what to build.
Watch the 3s as carefully as the 1s
Neutral responses are the quiet risk. A 1 is someone engaged enough to be angry, often recoverable; a 3 is someone who found your product unremarkable, which is the sentiment most strongly associated with drifting away without ever complaining. When your 3s grow as a share of responses, treat it as seriously as a rise in 1s.
High CSAT and rising churn is a common, confusing combination. It usually means your individual interactions are fine while something structural (price, a missing capability, a workflow that requires three tools) is driving the decision to leave. CSAT can't see that, by design. Pair it with a relationship metric, an effort metric, and an exit survey, and the picture resolves.
8 Ways to Actually Improve Your CSAT Score
1. Fix the worst touchpoint, not the average
Improvements to a touchpoint already at 91% are invisible in the blend. Rank touchpoints by score × volume, take the lowest-scoring high-traffic one, read its verbatims, and fix what they name. Then re-measure that touchpoint specifically.
2. Close the expectation gap before the interaction
A large share of dissatisfaction is a mismatch between what people expected and what happened: an import that takes ten minutes when nothing said so, a feature that works differently than its name implied. Setting expectations up front is often cheaper than changing the experience, and it moves the score just as much.
3. Reduce effort, not just problems
Effort and satisfaction are tightly linked: a task that took four steps and two tabs will score poorly even when it succeeded. Count the steps in your lowest-scoring flows and remove one. That's usually a bigger move than anything you could add.
4. Answer the questions inside the product
Much dissatisfaction is confusion that nobody bothered to report. Contextual guidance where people hesitate (clearer microcopy, a tooltip, a short walkthrough, an in-app support layer) removes the friction and the ticket at once.
5. Make failures explain themselves
Every silent failure is a guaranteed low score. An error that says what happened, why, and what to do next converts a frustrating dead end into a solvable problem, and error-handling quality shows up in CSAT faster than almost any feature work.
6. Follow up on low scores individually, at first
Reaching out personally to people who scored 1 or 2 does two things: it occasionally recovers the relationship, and it always teaches you more than the survey did. It doesn't scale, and it isn't meant to. Do it for the first fifty, extract the patterns, then fix the patterns.
7. Fix onboarding to lift everything downstream
Users who never reached value rate everything lower, permanently. Satisfaction scores across a product often turn out to be a lagging indicator of activation, which means the fastest route to a better CSAT is frequently a better first week.
8. Tell people what changed because they answered
Publish the fixes that came from feedback in your release notes and, where you can, reply to the person who reported it. It raises response rates on the next wave, and it converts a measurement programme into a visible relationship.
CSAT: Do vs. Don't
✅ Do
- Ask about one specific interaction
- Trigger immediately after that interaction
- Count only the top two boxes
- Publish the response count with every score
- Always include an optional open follow-up
- Segment before drawing conclusions
- Compare touchpoints inside your own product
- Watch neutral 3s as closely as angry 1s
❌ Don't
- Ask "how satisfied are you with us?" quarterly by email
- Include the neutral option in the satisfied count
- Change the scale or wording mid-year
- Report a score built on a handful of responses
- Use leading or double-barrelled questions
- Treat a high score as evidence against churn risk
- Chase a cross-industry benchmark you can't inspect
- Collect verbatims that nobody reads or tags
Running CSAT In-Product Without Engineering Time
The thing standing between most teams and a useful CSAT programme is not analysis; it's that every new question needs a frontend ticket. With Kompassify, satisfaction surveys run on top of your live product with no code:
- Build the question visually. Pick the scale, write the wording, add the open follow-up, choose slide-in or bar: published live, no release.
- Trigger it on the real moment. After an import finishes, after onboarding completes, after the third use of a feature: the timing that makes CSAT worth measuring.
- Ask the right people, not everyone. Target by segment and cap frequency, so the same user is never asked twice in a month.
- See the score with its context. Responses land next to the tours, checklists and behaviour that produced them, so a low score comes with the journey attached.
- Fix and re-measure in the same week. Because guidance ships without a release, you can address what the verbatims named and watch the touchpoint's score move.
Kompassify is GDPR compliant and EU-hosted, free for under 100 monthly active users, with paid plans from $129/month.
Measure Satisfaction Where It Happens
Kompassify lets you run CSAT and other in-app surveys at the exact moment that matters, triggered by real behaviour, targeted by segment, and answered in one click. See which touchpoint is weak, fix it without a release, and watch the score move. GDPR compliant, EU-hosted, and free for under 100 monthly active users.
Start for Free →Frequently Asked Questions
What is CSAT (customer satisfaction score)?
CSAT is a metric that measures how satisfied users are with one specific interaction, feature or experience. You ask a single question, typically 'how satisfied were you with X?' on a 1-to-5 scale, and report the percentage of respondents who chose one of the top two options. Its defining property is narrowness: CSAT is a transactional measure attached to a moment, not a verdict on the whole relationship. That is precisely what makes it actionable, and why a company-wide CSAT number is usually the least useful version of it.
What is the CSAT formula?
CSAT = (number of satisfied responses ÷ total responses) × 100, where 'satisfied' means the top two options on a five-point scale, a 4 or a 5. If 120 people answer and 86 choose 4 or 5, CSAT is 86 ÷ 120 × 100 = 72%. Two conventions matter for comparability: count only the top two boxes rather than everything above the midpoint, and report the response count alongside the score, because a 90% built on nine responses is noise wearing a percentage sign.
What is the difference between CSAT, NPS and CES?
They answer different questions. CSAT asks 'how satisfied were you with this specific thing?' and is measured right after an interaction. NPS asks 'how likely are you to recommend us?' and measures the overall relationship over time. CES asks 'how easy was this to do?' and measures effort on a particular task, which tends to predict churn better than satisfaction does. A healthy programme runs one relationship metric continuously and one or two transactional metrics at the moments where you have decisions to make.
What is a good CSAT score?
Comparable benchmarks are harder to find than they look, because the score depends on the scale used, the wording, the moment of asking and who responds, all of which vary between the companies publishing numbers. A far more useful comparison is internal: your own trend over time, and the differences between touchpoints. A CSAT of 78% on your importer against 91% on the rest of the product is a clear signal regardless of what any industry average says.
When should you send a CSAT survey?
Immediately after the interaction you are asking about, and never as a general check-in. After a support conversation is resolved, after an onboarding step completes, after a first export, after a feature is used. The value of CSAT comes from the tightness of the link between question and moment. Asked a week later, or asked about 'your experience with us' in general, it becomes a mood reading that never moves and never explains anything.
Why is my CSAT score always high but customers still churn?
Usually response bias plus the wrong instrument. The people who answer are disproportionately those who just had a good experience; users who are quietly frustrated tend to close the survey. And satisfaction with individual interactions can stay high while the overall relationship deteriorates for reasons CSAT never asks about: price, a missing capability, a competitor. Pair CSAT with a relationship measure like NPS, watch effort with CES, and treat unanswered surveys as data rather than absence of data.
How do you run CSAT surveys without engineering time?
With a no-code platform like Kompassify you can build a CSAT microsurvey visually, trigger it on the exact event you want to measure, target it to a specific segment, cap how often any user is asked, and publish it to your live product without a release. Responses arrive with the behaviour that produced them, so a score always comes with context, and the open follow-up sits next to it. Kompassify is GDPR compliant and EU-hosted, free for under 100 monthly active users, with paid plans from $129/month.