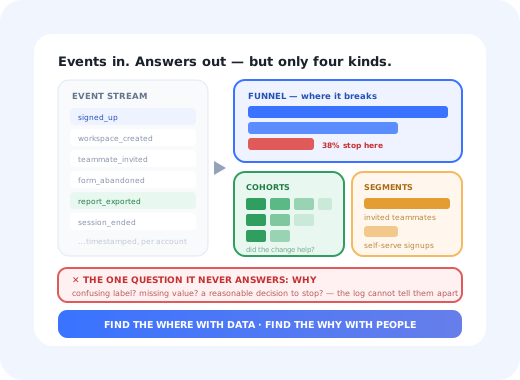
There is a particular kind of meeting where someone opens an analytics tool, scrolls through a dozen charts, and everyone agrees that engagement looks a bit soft. Nobody leaves with a decision. The data was fine. The problem was that no question was asked before the charts were opened, so every number was equally interesting and none of them was actionable.
Behavioral analytics is unusually good at answering precise questions and unusually bad at rewarding browsing. It records what people did, in order, with timestamps, per account, which makes it the most honest evidence a product team has. It also records nothing about why, which makes it the easiest evidence to over-interpret.
This guide covers what behavioral analytics is and where it sits among your other data, the four questions it can genuinely answer, the six analyses that cover almost every real product question, the event layer everything depends on, and a working method for going from a question to a decision.
Key Takeaways
- Behavioural data answers "what", never "why". Pair every finding with a qualitative source before acting on it.
- Start from a decision, not a tracking plan. If no answer would change what you do, the analysis is entertainment.
- Six analyses cover almost everything: funnels, cohorts, paths, segments, retention and feature usage.
- Segmentation is where the finding usually lives. An aggregate is the average of two different products being used by two different people.
- You cannot analyse what you did not instrument, but instrumenting everything produces a swamp, not a dataset.
- Survivor bias is built in. The users who left generated the least data and are the ones you most need to understand.
What Is Behavioral Analytics?
Behavioral analytics: definition
Behavioral analytics, also written behavioural analytics, is the practice of analysing what people actually do inside a product, using the record of their actions rather than their stated opinions. It is built on events: discrete, timestamped records that a particular user or account performed a particular action. From a well-designed event stream you can reconstruct sequences, compare groups, and measure whether behaviour persists over time.
It is one of three kinds of evidence about your customers, and the three fail in different directions.
| Type | Source | Good at | Blind to |
|---|---|---|---|
| Behavioural | Event data: what people did | Truth about actions, scale, sequence, timing | Motive, intent, and anything you did not instrument |
| Attitudinal | Surveys, interviews, reviews: what people say | Motive, expectation, emotion, vocabulary | Accuracy: people misremember and rationalise |
| Business | Billing, CRM, support systems | Consequences in money and contracts | Everything that caused those consequences |
The pairing that produces most good decisions is behavioural plus attitudinal: the event data finds the step where a third of accounts stall, and a survey or a short interview at that step tells you what was going on. Using either alone produces a familiar failure: confident conclusions from a funnel chart, or a roadmap built entirely from what the five loudest customers said.
The Four Questions Behavioural Data Can Answer
Almost every legitimate use of behavioral analytics is one of these four. Naming which one you are asking prevents the most common waste: opening a tool with no question and closing it with no decision.
The fourth question is where the value is; the fifth is where the mistakes are.
The Six Core Analyses
You do not need a taxonomy of twenty chart types. Six analyses answer nearly every product question, and each has a specific failure mode worth knowing before you run it.
-
Funnel analysis: where a defined sequence loses people
Pick the steps deliberately; a funnel is an assertion about the path, and a badly chosen one manufactures a drop-off that does not exist. The onboarding version is in the user onboarding funnel.
-
Cohort analysis: whether a change actually helped
The only honest way to compare before and after, because it holds start date constant. Without it, growth in new users flatters every metric. See cohort analysis.
-
Path analysis: the routes people actually take
Reveals the detours and loops your designed flow does not contain. Prone to producing beautiful diagrams with no conclusion, so bound it: paths from one specific screen, for one segment.
-
Segmentation: the split that contains the finding
Rarely an analysis on its own and almost always the step that makes the other five useful. See user segmentation.
-
Retention analysis: whether the behaviour persists
The curve that settles at a plateau describes a product with a durable use case; the one that decays to zero describes a demo. See retention curves.
-
Feature usage: breadth and depth of adoption
Which capabilities are used, by whom, how often, and which ones a segment has never touched. See feature adoption.
Two adjacent methods are worth naming because they answer the "where it broke" question in a different register: session replay lets you watch an individual struggle, and heatmaps aggregate attention on a single screen. Neither scales to a conclusion on its own; both are excellent at generating the hypothesis you then test with a funnel.
What Behavioral Analytics Cannot Tell You
Four limits, and every one of them has produced a confident wrong decision somewhere.
An abandoned step could be confusion, a missing value, an interruption, or a sensible decision to stop. The log cannot tell you which.
Accounts that use the integration retain better. Does the integration cause retention, or do committed accounts do both? Only an experiment separates those; see A/B testing onboarding.
Anything you did not track is invisible, and the gap is usually discovered mid-analysis, weeks after the data would have needed to exist.
Users who churned early generated the least data, so every aggregate is weighted toward survivors, the people whose problems you already solved.
The survivor-bias trap in one sentence: "our most successful accounts all use feature X, so we should push feature X" is a conclusion drawn from the accounts that survived long enough to discover feature X. Test it on a cohort of new accounts before you rebuild onboarding around it.
The Event Layer Everything Depends On
Behavioral analytics is only as good as the events beneath it, and the most common way to ruin the practice is to instrument enthusiastically and inconsistently. Five rules prevent most of the damage.
- Name events for user intent, not implementation:
report_exported, notbtn_click_17. - Use one naming convention and enforce it: object then past-tense verb, consistently, forever.
- Put the detail in properties, not in event names: one
report_exportedevent with aformatproperty beats four separate events. - Instrument the outcome, not only the click: a button press that failed silently is not a completed action.
- Attach account as well as user: in B2B, almost every interesting question is about accounts, and retrofitting that link is painful.
Designing this properly is a discipline of its own, and getting it wrong is expensive to undo because historical data cannot be re-recorded. The full method (taxonomy, properties, governance, and how to keep it from rotting) is in event tracking. Read that before instrumenting; read this one to decide what to instrument first.
How to Run a Behavioral Analysis in 6 Steps
The steps are simple. The discipline is doing them in order, particularly the first, which is the one that gets skipped when a dashboard is already open.
- Write the decision the analysis will inform
- Turn it into one measurable question
- Pick the analysis and the segment before you look
- Look, and check the shape before the number
- Find out why, using a different method
- Change something, then re-cut the same view by cohort
1. Write the decision the analysis will inform
One sentence: "we will either rebuild the second onboarding step or leave it alone". If you cannot name a decision that changes based on the answer, stop: you are browsing, and browsing costs an afternoon and produces a screenshot nobody acts on.
2. Turn it into one measurable question
"What share of new accounts complete step two within seven days, and how does that differ between self-serve signups and invited teammates?" Specific enough that the chart either answers it or does not. "How is engagement doing" fails this test.
3. Pick the analysis and the segment before you look
Committing in advance is what stops you from finding a pattern in whichever split happened to look interesting. It also forces the segment decision to be deliberate: role, plan, company size, acquisition channel, or cohort, chosen because you expect it to matter, not because it was in the dropdown.
4. Look, and check the shape before the number
Before reading any value, check the volume in each bucket, the date range, and whether the curve looks plausible. Most "surprising findings" are instrumentation changes, a release that renamed an event, or a segment containing eleven users. A number that contradicts everything you know about the product is far more likely to be a bug than a discovery.
5. Find out why, using a different method
This is the step that turns data into a decision. Watch five replays of the drop-off. Put one question on that screen for a week. Call three customers who stalled there. Behavioural data has now told you exactly where to point a qualitative method, which is the most efficient way to use both; in-app surveys and usability testing cover the two cheapest options.
6. Change something, then re-cut the same view by cohort
Ship the fix, then compare the cohort that arrived after the change with the one before it, not the overall metric, which will be dominated by the accounts already in the base. If the new cohort's curve does not move, the hypothesis was wrong, and knowing that quickly is the whole point.
One question at a time. Analyses that try to answer four questions at once produce dashboards that answer none. A single well-chosen funnel, split by one segment, has changed more products than any wall of tiles.
Behavioral Analytics: Do vs. Don't
Do
- Start from a decision and write it down first
- Instrument a small set of events well, then extend
- Segment before concluding: the aggregate hides the finding
- Pair every behavioural finding with a qualitative check
- Compare cohorts, not before-and-after totals
- Check bucket sizes before believing a percentage
Don't
- Track everything "so we have it later"
- Read causation out of a correlation
- Draw conclusions from survivors alone
- Name events after buttons or components
- Present a path diagram with no question attached
- Let a dashboard outlive the decision it was built for
Behavioral Analytics for the Part That Matters Most
The highest-value behavioural questions in most SaaS products sit in the first two weeks: which step loses people, which segment stalls, which early action separates the accounts that stayed from the ones that left. That is also the part of the product where instrumentation is most often missing, because onboarding flows change frequently and tracking plans do not keep up.
Kompassify closes that gap from the guidance side. Every onboarding checklist, product tour, tooltip, hotspot and in-app survey reports its own numbers (which step was completed, where people abandoned, which segment finished and which did not) so the onboarding funnel exists as a by-product of building the onboarding rather than as a separate engineering project. When the analysis points at a step, the same editor changes it, and the next cohort tells you whether it worked. The full set of measures worth watching in that window is in user onboarding metrics.
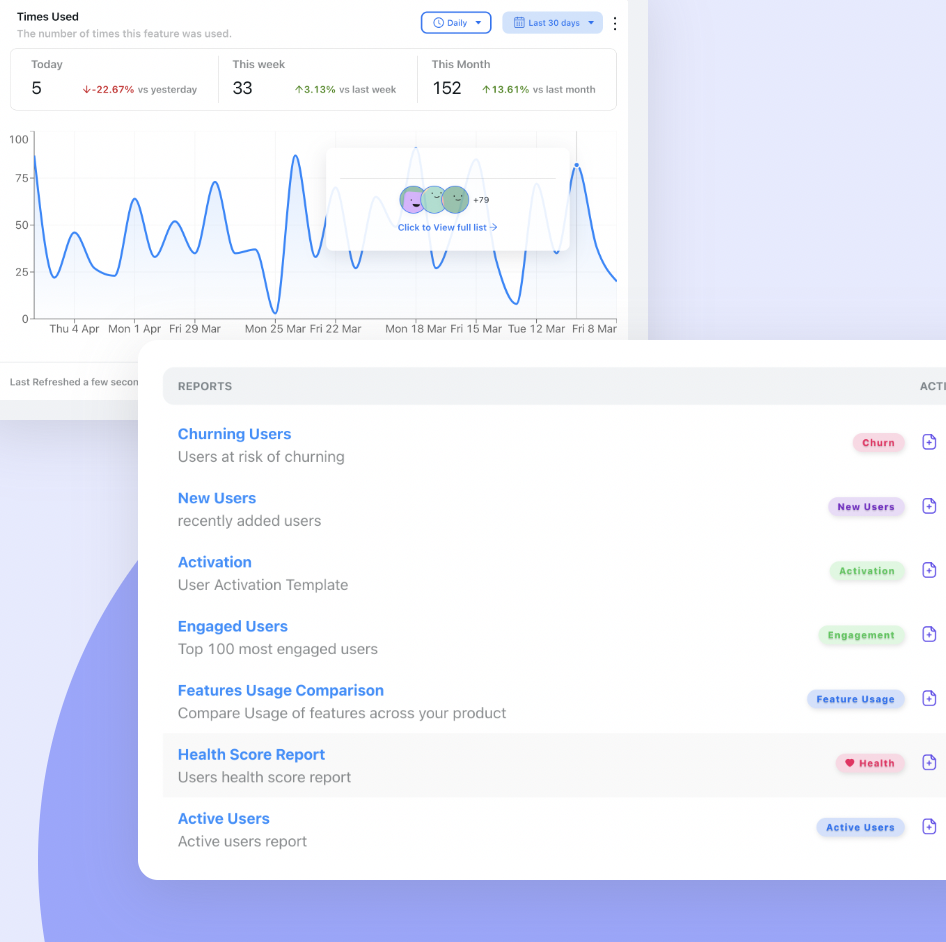
Step-level completion is behavioural data you get for free when the guidance reports on itself.
See exactly where users stall, without a tracking project
Kompassify lets product, onboarding and customer-success teams build guided onboarding, contextual help and in-app surveys, with completion and engagement data on every one. Free up to 100 monthly active users, plans from $129/month, GDPR-compliant and EU-hosted.
Start for free →The One-Sentence Version
Behavioral analytics tells you truthfully what people did and nothing about why they did it, so start from a decision, instrument a small set of events well, segment before you conclude, and always send a qualitative method to the exact spot the data pointed at.
Frequently Asked Questions
What is behavioral analytics?
Behavioral analytics, also spelled behavioural analytics, is the practice of analysing what people actually do inside a product, using the record of their actions rather than their opinions. It works from event data: discrete, timestamped records that a specific user or account did a specific thing. From those events you can build funnels, cohorts, paths, segments and retention curves. Its defining property is that it describes behaviour truthfully and motive not at all, which is why it works best paired with a method that can ask people why.
What is the difference between behavioral analytics and product analytics?
The terms overlap heavily and are often used interchangeably. Product analytics usually names the discipline and the tooling: everything you measure about a product, including performance, revenue and adoption. Behavioral analytics names the subset built specifically on user actions: what people did, in what order, how often, and what that predicts. In practice, if your analysis starts from an event log of user actions rather than from a revenue table or a server metric, you are doing behavioral analytics.
What can behavioral analytics not tell you?
It cannot tell you why. An event log shows that forty percent of accounts abandoned a form at the same field; it cannot distinguish between a confusing label, a value they did not have to hand, and a legitimate decision to stop. It also cannot see anything you did not instrument, cannot separate correlation from causation without an experiment, and systematically under-represents the users who left before generating much data. Every strong behavioural finding should be paired with a qualitative source (a replay, a survey at that step, or a short interview) before it becomes a decision.
What are the main types of behavioral analysis?
Six cover almost everything worth doing: funnel analysis, which shows where people drop out of a sequence you defined; cohort analysis, which compares groups that started at different times so you can tell whether a change helped; path analysis, which shows the routes people actually take rather than the ones you designed; segmentation, which splits any of the above by who the user is; retention analysis, which shows whether usage settles at a stable level or decays to zero; and feature-level usage, which shows breadth and depth of adoption. Most product questions reduce to one of these six, applied to a well-chosen segment.
How do you start with behavioral analytics?
Start from a question, not from a tracking plan. Write down one decision you would make differently depending on the answer, then instrument the smallest set of events that answers it: usually signup, the two or three steps toward first value, and the action that means value was delivered. That handful of events supports a funnel, a cohort view and an activation rate, which is enough to run a product for months. Teams that begin by tracking everything end up with thousands of events, no naming convention and no answers.
Can you do behavioral analytics without a data team?
For the onboarding and adoption questions that matter most, yes. If your in-app guidance reports its own numbers, which step of a checklist was completed, which tour was finished, which tooltip was seen, which survey was answered, you already have a behavioural dataset for the part of the product where the biggest decisions get made. Kompassify works this way: every guide, checklist, tooltip and survey reports completion and engagement per segment, so a team can find the step that loses people without waiting for a tracking plan and a pipeline.