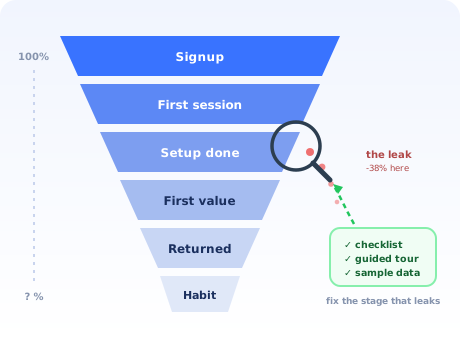
Ask a team how their onboarding performs and you usually get a feeling: "pretty good", "needs work", "we lose a lot of people". Ask where exactly new users stop, and the room goes quiet. The overall number (signups in, active users out) is known; everything between is fog.
The onboarding funnel is the instrument that burns off the fog. Instead of one opaque conversion rate, you get a series of stages with a survival rate at each transition, and suddenly "onboarding isn't working" becomes "we lose a third of users at workspace setup, and another quarter never come back after a successful first session". Those are problems you can actually fix, and they have different fixes.
This guide covers the six stages worth measuring, how to define the events between them without fooling yourself, how to run the funnel analysis, what the common leak patterns mean, and the right fix for each kind of leak.
Key Takeaways
- The funnel localises the problem. One overall conversion rate hides everything; per-stage survival rates point at the exact transition that leaks.
- One concrete event per stage. "Engaged" is not an event. "Sent first invoice" is. Vague stage definitions produce funnels that flatter and mislead.
- Time windows are part of the definition. A user who activates after 60 days was not onboarded; they re-discovered you. Give each transition a realistic deadline.
- Segment before concluding. An aggregate funnel averages a healthy segment with a broken one; the split is where the insight is.
- Fix the biggest leak, then re-measure. One transition per cycle: funnel work is iterative, not a redesign.
- The funnel diagnoses; guidance fixes. Checklists, tours and contextual tips are how you repair a leak without waiting for an engineering sprint.
What is a user onboarding funnel? (Definition & meaning)
Definition: A user onboarding funnel is the sequence of stages a new user passes through between signing up and becoming a regular user, with the share of users surviving each transition measured at every step. Funnel analysis is the practice of reading those per-stage numbers to locate where users are lost, so fixes can target the leaking stage instead of the whole journey.
The word funnel is doing honest work: at every stage, some users continue and some stop, so the cohort narrows as it flows. That narrowing is not intrinsically a failure (some signups were never a fit) but the rate of narrowing at each stage is the most information-dense picture of onboarding health a team can have.
The funnel is also the connective tissue between metrics this blog covers individually: activation is one gate inside it, time to value is how fast users cross its middle stages, and onboarding metrics catalogues the numbers the funnel organises into a story.
The six stages of the onboarding funnel
Products differ, but this six-stage skeleton fits most SaaS and adapts cleanly. The names matter less than the discipline: each stage is entered by exactly one concrete, unambiguous event.
1. Signup completed
The account exists. Everything before this (visits, pricing views, form starts) belongs to the marketing funnel, which is a different instrument with different owners. One caveat worth importing from there: the signup flow sets the expectations the rest of the funnel must honour.
2. First session started
The user actually enters the product and does something, not merely receives a verification email. The gap between stages 1 and 2 is chronically underestimated: verification links that never arrive, users who sign up on mobile for a desktop product, curiosity signups that were never going to continue.
3. Setup done
The minimum configuration that makes the product usable for this user: workspace created, data source connected, first project made. Define this stage tightly: it is the funnel's most common cliff, because it is where the product asks for effort before giving anything back.
4. First value reached
The aha moment: the first genuinely useful result, the report generated, the message sent, the automation run. This is the activation gate, and it should be the same concrete event your activation metric uses. If you cannot name this event, stop building the funnel and go find it first.
5. Returned within a week
The user came back voluntarily. First value that never leads to a second visit was a demo, not an adoption; this stage exists to catch exactly that pattern, which raw activation numbers hide.
6. Habitual use
Usage at the product's natural frequency (daily for a communication tool, monthly for an invoicing one) sustained without prompting. This is where the onboarding funnel hands over to retention, and its curve takes over the storytelling.
Time windows are half the definition. Each transition needs a deadline calibrated to your product's rhythm, say, first session within 48 hours of signup, first value within a week or two. Without windows, a user who wanders back after two months counts as "converted" and your funnel slowly inflates into fiction. With windows, each monthly cohort closes cleanly and cohorts become comparable.
How to run an onboarding funnel analysis in 5 steps
- Define one event and one time window per stage
- Measure a full signup cohort against the funnel
- Find the single largest drop-off
- Segment the leak before diagnosing it
- Learn why from the users who stalled, then fix, re-measure, repeat
1. Define one event and one time window per stage
Write the funnel as a table: stage, entering event, window. Resist composite definitions ("completed setup or viewed three pages"): every or in a stage definition is a place your funnel can lie to you. If your product has genuinely different paths to value, that is a signal to build one funnel per persona, not to blur one funnel until it fits everybody.
2. Measure a full signup cohort against the funnel
Take everyone who signed up in a month and compute what share reached each stage within its window. Cohorts matter: measuring "all users ever" mixes 2024's onboarding with last week's and averages away every change you have shipped. One month per cohort is granular enough to see movement and large enough to dampen noise for most products.
3. Find the single largest drop-off
One transition will stand out; it almost always does. That transition is the entire agenda. The discipline this step enforces is sequencing: a team that fixes its worst leak each cycle compounds; a team that redesigns the whole journey every quarter never learns which change did what.
4. Segment the leak before diagnosing it
Split the leaking transition by acquisition source, persona and device. Aggregate funnels average a healthy segment with a broken one and point you at ghosts: a brutal setup drop-off might be entirely explained by one ad campaign delivering wrong-fit signups, or by mobile users hitting a desktop-only step. Segmentation turns "users drop at setup" into "these users drop at setup", which is halfway to the fix.
5. Learn why from the users who stalled, then fix, re-measure, repeat
The funnel says where; it never says why. Watch session recordings of users who stopped at the leaking stage, or ask them directly with a targeted in-app survey: one question, shown precisely at the stall point. Then ship the fix, wait for the next cohort, and read the funnel again. The loop is the method; a funnel measured once is trivia.
Reading the leaks: what each drop-off pattern means
| Leak location | Usual causes | Right fix |
|---|---|---|
| Signup → first session | Verification friction; marketing promised a different product; mobile signups for a desktop tool | Fix email deliverability, align the landing promise, defer verification until after first value where possible |
| First session → setup done | Too many steps before any payoff; empty screens; unclear first action | Cut steps, seed sample data, add an onboarding checklist and a short guided path |
| Setup → first value | The path to the aha moment is long or invisible; users configure but never use | Guide directly to one concrete first win with a product tour; shorten the distance between setup and result |
| First value → return | First session ended without a reason to come back; value was seen once, not embedded | End session one with a scheduled payoff (report, digest, teammate invite); re-engage by email tied to what they built |
| Return → habit | The recurring use case never took hold; the product solved one task, not a routine | Contextual guidance toward the repeating workflow; see our guide to product stickiness |
On benchmarks: resist the urge to grade your funnel against published conversion numbers; they mix incompatible definitions, markets and price points, and the same "40%" can be excellent or alarming depending on what was counted. The comparison that pays is internal: this cohort vs last cohort, this segment vs that one, before the change vs after. A consistently measured funnel becomes its own benchmark.
Onboarding funnel analysis: Do vs. Don't
✅ Do
- Tie every stage to one concrete event
- Give every transition a realistic time window
- Measure monthly signup cohorts, not "all users ever"
- Attack the single largest drop-off first
- Segment by source, persona and device before diagnosing
- Pair the numbers with recordings or a one-question survey
- Re-measure the next cohort after every fix
- Build separate funnels for genuinely different personas
❌ Don't
- Define stages with "or" clauses and soft verbs like "engaged"
- Let users without time limits inflate conversion
- Judge your funnel against other companies' numbers
- Redesign the whole journey off one aggregate chart
- Treat tour completion as a funnel stage; it is a means, not an outcome
- Average wrong-fit signups into product conclusions
- Stop measuring once the worst leak is fixed
- Confuse the onboarding funnel with the marketing funnel
Fixing the funnel without waiting for a release
Look back at the fixes in the leak table: checklists, guided first wins, contextual tours, targeted surveys, sample-data nudges. Almost none of them are product rebuilds; they are guidance, layered onto the product at the stage that leaks. Which means the constraint is rarely engineering capacity; it is whether the team has a way to ship guidance without a release cycle.
That is the loop Kompassify closes. You build product tours, onboarding checklists, tooltips and in-app surveys in a no-code editor, target them at the exact stage and segment your funnel says is leaking, and measure completion and progression in the built-in analytics. Diagnose on Monday, ship the fix on Tuesday, read the next cohort with the change live. Free up to 100 monthly active users, GDPR-compliant and hosted in the EU.
Find Your Leak. Fix It This Week.
Kompassify lets you patch the exact stage where your onboarding funnel leaks: no-code tours, checklists, tooltips and surveys, targeted by segment and measured end to end. Free up to 100 monthly active users, GDPR-compliant, EU-hosted.
Start for Free →Frequently Asked Questions
What is a user onboarding funnel?
A user onboarding funnel is the sequence of stages a new user passes through between signing up and becoming a regular user, typically signup, first session, setup, first value, and habit, with the share of users surviving each transition measured at every step. It turns the vague question of whether onboarding works into a specific one: exactly where do users stop, and how many. The funnel is the diagnostic tool; the fixes then target the leaking stage.
What is funnel analysis?
Funnel analysis is the practice of defining an ordered series of events users should complete, measuring what share of users progresses through each transition within a time window, and locating where the largest drop-offs occur. Its power is in localisation: overall conversion from signup to activation might be disappointing, but the analysis shows whether the loss happens at email verification, at first setup, or between first success and second visit: three completely different problems with different fixes.
What are the stages of an onboarding funnel?
A useful default for SaaS has six: signup completed; first session started (the user actually enters the product); setup done (the minimum configuration that makes the product usable); first value reached (the aha moment, the first genuinely useful result); return within a week (the user comes back voluntarily); and habitual use (the product enters their routine). Adapt the middle stages to your product, but keep each stage tied to one concrete, unambiguous event.
How do you analyze an onboarding funnel?
Define one concrete event per stage, pick a realistic time window per transition, and measure a cohort of new signups against it. Read the result looking for the single largest drop-off, then segment it: split by acquisition source, persona, and device to see whether the leak is universal or concentrated in one group. Finally, watch the recordings or survey the users who stalled at exactly that stage to learn why. Fix that one transition, re-measure the next cohort, and repeat.
Where do most users drop off in onboarding?
The two classic cliffs are the setup stage, where the product asks for work (configuration, imports, invites) before showing any value, and the gap between first session and second visit, where users who did not reach anything valuable simply never return. Signup-to-first-session losses usually point at email verification friction or broken expectations from marketing. Every product's funnel is different, which is exactly why measuring beats folklore.
How do you fix onboarding funnel drop-off?
Match the fix to the leaking stage. Signup leaks: shorten the form and defer optional fields. First-session leaks: fix verification friction and align the landing promise with the product reality. Setup leaks: cut steps, seed sample data, add a checklist and guided walkthrough. First-value leaks: shorten the path to the aha moment and guide users there. Return leaks: end the first session with a reason to come back and use email to re-engage. Habit leaks: contextual guidance toward the recurring use case. The universal mistake is applying one generic fix to an undiagnosed funnel.
What is a good onboarding funnel conversion rate?
There is no universal benchmark worth trusting: the honest range differs by market, price point, audience and traffic source, and published numbers mix incompatible definitions of activation. The productive comparison is internal: this month's cohort against last month's, one segment against another, and the funnel before a change against after it. A funnel you measure consistently becomes its own benchmark, and improvements against it are real regardless of what anyone else's numbers claim.