Almost every struggling SaaS company believes it has product-market fit. The revenue is real, the logos are real, the customers say nice things on calls. And yet every new cohort has to be pushed into the product, growth is proportional to sales headcount, and nobody can quite explain why the numbers only move when someone is pushing them.
That is what an absence of fit looks like from the inside. It rarely looks like failure; it looks like effort. Product-market fit is the state where the effort stops being the thing producing the growth, where a defined group of people has a problem you solve better than their alternatives, and their behaviour proves it without you asking.
This guide covers the definition worth using, how to measure fit with two independent signals that must agree, how to run the 40% survey without fooling yourself, why fit is a property of a segment rather than a company, the false positives that mislead almost everyone, and how onboarding strategy differs before and after you have it.
Key Takeaways
- Fit is behavioural, not emotional. People return unprompted, tell others, and would be genuinely disrupted if you disappeared.
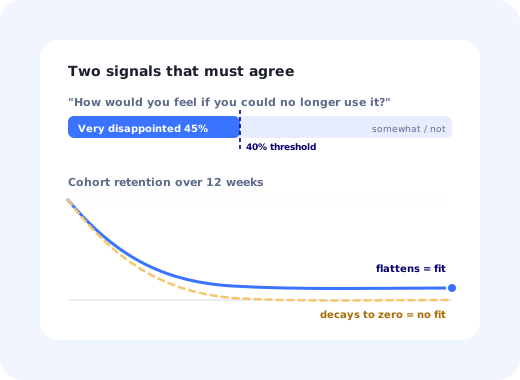
- Two signals, and they must agree. The stated one is the 40% survey; the behavioural one is a retention curve that flattens.
- Fit belongs to a segment. "Do we have product-market fit?" is unanswerable; "do we have it with mid-market operations teams?" is not.
- Most false positives are effort in disguise: a supported enterprise deal, a launch spike, a captive audience, a flattering sample.
- Before fit, narrow. Serve the sub-segment with the strongest signal even at the cost of being less useful to everyone else.
- Onboarding changes role at fit: a research instrument before, a conversion system after.
What Is Product-Market Fit?
Product-market fit: definition
Product-market fit is the state in which a specific group of people has a problem your product solves better than their available alternatives, and behaves accordingly: they return without prompting, they recommend it unasked, and losing it would genuinely disrupt their work. It is a measurable relationship between one product and one market segment, not a company-wide status and not a stage of funding.
Three parts of that definition do real work. Specific group: fit is never universal, and averaging across segments is how teams hide the truth from themselves. Better than their alternatives: the comparison is never against nothing; it is against a spreadsheet, an agency, a competitor, or doing nothing at all, and "doing nothing" is a far stronger opponent than most roadmaps assume. Behaves accordingly: the evidence is what people do, not what they say in a friendly call.
A blunt test that works surprisingly well: if you stopped all outbound sales and paid acquisition tomorrow, would anyone new still show up next month, and would this month's users still be here? Fit is the condition under which the answer to both is yes.
How to Measure Product-Market Fit
Use two independent signals and require them to agree. Either one alone can be talked into saying what you want.
| Signal | What it is | Threshold | How it lies to you |
|---|---|---|---|
| Stated | The product-market-fit survey: share of users who would be "very disappointed" to lose the product. | Around 40% | Sample your happiest users and it will clear 40% for a product with no fit at all. |
| Behavioural | Cohort retention curve: does it flatten, or decay toward zero? | A visible plateau | A flat curve at 4% is a niche of captives, not a market. |
| Corroborating | Organic acquisition share, unprompted referrals, expansion within accounts. | Rising without spend | A launch or press mention produces the same shape for one month. |
When the two disagree, the disagreement is the finding. A high survey score with a decaying curve almost always means you surveyed the survivors. A flat curve with a weak survey score usually means a small group with no alternative: real revenue, but not a market you can grow into.
The 40% Test: How to Run It Properly
The survey is one question, and almost all of its value depends on details around it. The question:
The question
"How would you feel if you could no longer use [product]?"
:
Very disappointed · Somewhat disappointed · Not disappointed (it isn't
that useful)
(The only number that counts is the first segment. "Somewhat disappointed" is not partial credit; it is a polite no.)
Four rules decide whether the number means anything:
1. Ask people who have actually experienced the product
A common qualifying rule is: used the product at least twice in the last two weeks, and completed the core action at least once. Survey everyone who ever signed up and you are measuring your onboarding, not your fit. Survey only power users and you are measuring your own optimism.
2. Ask in the product, not by email
Email samples the people with time and goodwill. An in-app survey shown after a real session reaches the people whose behaviour you are trying to interpret, and typically returns several times the response rate. Trigger it after the core action rather than on page load; see onboarding triggers for the timing mechanics.
3. Segment the answers before reading them
A blended 31% can easily be 52% among one role and 12% among another. That decomposition is the most valuable output of the whole exercise, because it tells you who to build for. Break the score down by role, company size, use case and acquisition channel at minimum; user segmentation is doing the real analytical work here, not the headline number.
4. Read the follow-up questions harder than the score
Ask three: what would you use instead?, what is the main benefit you get?, and what should we improve? Then read the first two only among the "very disappointed" group. Their words describe the market you fit, in language you can put straight on a landing page. The improvement requests from the "not disappointed" group are the ones to ignore; building for people who would not miss you is how roadmaps get lost.
On the number 40 itself: it is a heuristic derived from comparing companies that went on to grow well against those that did not, not a physical constant. A product at 36% with a flattening retention curve and rising organic signups is in better shape than one at 44% from a sample of forty enthusiasts. Use the threshold to force a decision, not to settle an argument.
Fit Belongs to a Segment, Not a Company
"Do we have product-market fit?" is close to unanswerable. "Do we have product-market fit with operations managers at 50–200 person logistics companies?" is a question with an answer, a number, and a decision attached to it.
This matters most during expansion. The overwhelmingly common story is not a company losing fit; it is a company keeping fit in its original segment, moving up-market or into an adjacent vertical, never establishing fit there, and reading the blended average as decay. The blended number falls, the team concludes the product is getting worse, and the fix applied is to the wrong segment entirely.
Often a mix shift, not a decline. Recompute the original segment separately before reacting.
Frequently the first evidence that you are now selling to a segment where the product does not fit.
Humans compensating for a gap between what the new segment needs and what the product does.
Four False Positives That Fool Almost Everyone
-
The heavily supported enterprise deal
Real revenue delivered by people rather than product. The test: remove the dedicated support and see what survives. If usage collapses, you sold a service.
-
The launch spike
A press mention or a launch-day surge produces every top-of-funnel number you want and no second week. Judge a spike only by the cohort's week-four behaviour.
-
The captive audience
Users who cannot leave (mandated internal tools, contractual lock-in) retain beautifully and prove nothing about fit. Their retention is a fact about their employer.
-
The flattering sample
Any survey sent to a list curated by enthusiasm. If the sample was chosen by anyone who wants a good result, the result is not evidence.
All four share a signature: growth that is proportional to input. When you push, numbers move; when you stop, they stop. Fit shows up as the residual: what continues happening when nobody is pushing.
What to Do Before You Have Fit
The instinct when the number comes back at 22% is to add features for the people who said "somewhat disappointed". It is almost always wrong. The productive move is the opposite one: narrow until the signal is strong somewhere.
- Find the sub-segment with the highest "very disappointed" share and the flattest retention curve. It exists, even if it is small.
- Read what that group says the main benefit is, and rewrite the positioning in their words.
- Build the next three things for them specifically, accepting that this makes the product less useful to everyone else.
- Keep onboarding manual and observed: watch real sessions, talk to people who dropped out, rewrite weekly.
- Re-measure. If the segment's score is climbing, you are on the right track even if the blended number has not moved.
The onboarding point deserves emphasis, because it is counter-intuitive for product teams who like systems. Before fit, onboarding is a research instrument: its job is to reveal where people get stuck and what they misunderstand. Automating it early freezes assumptions you have not yet tested. The related discipline of finding what to build is covered in jobs to be done and user personas.
What Changes After Fit
Once a segment retains and the survey holds up, the constraint moves. You now know what a successful user looks like; the problem becomes getting a much larger number of people to that state consistently. Onboarding stops being research and becomes a conversion system.
✓ After fit: do this
- Define activation as the behaviour your retained users all share.
- Build a repeatable guided path to it and measure drop-off per step.
- Segment onboarding by the use cases that showed fit.
- Shorten time to value aggressively.
- Re-run the survey quarterly, per segment.
✗ Before fit: avoid this
- Building a polished onboarding flow for a path you may abandon.
- Scaling paid acquisition into a leaking bucket.
- Adding features requested by people who would not miss you.
- Reporting a blended score across mismatched segments.
- Declaring fit because revenue grew.
Running the Survey Without Engineering Time
The practical obstacle to measuring fit properly is rarely analysis; it is that a well-targeted in-app survey needs targeting rules, a trigger tied to real behaviour, and the ability to change all of it next week when you decide to segment differently. That is a slow ticket in most roadmaps and a fast configuration in an adoption platform.
With Kompassify you can publish the product-market-fit question as an in-app survey, restrict it to users who have completed the core action twice, exclude anyone still in their first week, add the three open follow-ups, and break the results down by the segment attributes you already send. Because it is no-code, re-running it next quarter with different qualifying rules takes minutes. Kompassify is GDPR compliant and EU-hosted, free for under 100 monthly active users, with paid plans from $129/month.
Ask the Fit Question to the Right Users
Kompassify runs targeted in-app surveys triggered by real product behaviour, so your product-market fit score comes from qualified users, not from whoever opens email. No code, no release cycle. GDPR compliant, EU-hosted, free under 100 monthly active users.
Start for Free →Frequently Asked Questions
What is product-market fit?
Product-market fit is the state in which a specific group of people has a problem your product solves better than their alternatives, and behaves accordingly: they come back without being prompted, they tell other people, and taking the product away would genuinely disrupt them. It is not a feeling, a funding round or a revenue number. The most useful working definition is behavioural: a defined segment retains at a stable level over time and a meaningful share of them would be very disappointed if the product disappeared.
How do you measure product-market fit?
Use two independent sources and require both to agree. The stated measure is the product-market-fit survey: ask users how they would feel if they could no longer use the product, and look at the share answering "very disappointed": around 40% is the widely used threshold. The behavioural measure is retention: plot a cohort retention curve and check whether it flattens rather than decaying to zero. A high survey score with a decaying retention curve means you surveyed your most engaged users; a flat curve with a low score usually means a small captive segment rather than a market.
What is the 40% rule for product-market fit?
It is the benchmark popularised by Sean Ellis: ask users how they would feel if they could no longer use your product, offering "very disappointed", "somewhat disappointed" and "not disappointed", and treat roughly 40% answering "very disappointed" as the signal that you have fit. The number itself is a heuristic rather than a law: it was derived from comparing companies that grew well against those that did not. Its real value is the discipline it enforces: it makes you name a segment, ask a hard question and accept an uncomfortable answer.
Who should you send the product-market-fit survey to?
People who have genuinely experienced the product: a common rule is users who have used it at least twice in the last two weeks and have completed the core action. Surveying everyone who ever signed up inflates the denominator with people who never reached value and tells you about your onboarding rather than your fit. Surveying only your power users does the opposite and produces a flattering number that predicts nothing. Aim for at least a few dozen responses per segment, and always report the segment alongside the score.
Is product-market fit permanent once you have it?
No. Fit is a relationship between a product and a market, and both move. Competitors change the alternatives, customer expectations rise, and, most commonly, companies expand into adjacent segments where the fit they had does not hold. That is why fit should be measured per segment and re-measured periodically, rather than declared once. Many teams that believe they have lost fit have actually kept it in their original segment and never had it in the new one they started selling to.
What are the false positives that fool teams about product-market fit?
Four recur. Revenue from a heavily supported enterprise deal, where humans rather than the product are delivering the value. A spike from a launch or a press mention, which produces signups but no second week. High satisfaction scores from a small, captive group with no alternative. And a strong survey result from a sample of your most engaged users. Each looks like fit on a dashboard, and each fails the same test: cohorts do not retain, and growth stops the moment you stop pushing.
What should you do before you have product-market fit?
Narrow rather than broaden. Find the sub-segment with the strongest signal, usually visible as the group that retains best or answers "very disappointed" most often, and build for them specifically, even if it means being less useful to everyone else. Keep onboarding deliberately manual and observed rather than automated, because before fit the point of onboarding is to learn where people get stuck and why, not to scale. Automate it after the answer stops changing.
How does onboarding change after product-market fit?
Before fit, onboarding is a research instrument: small numbers, close observation, frequent rewrites. After fit, it becomes a conversion system, because you now know what the successful path looks like and the job is to get a much larger number of people down it consistently. That is the point at which structured in-app guidance, checklists, segmented flows and measured drop-off pay for themselves, and the point at which automating too early stops being a risk and starts being an obligation.