Customer lifetime value is the most quoted number in SaaS and one of the least reproducible. Ask two people in the same company what a customer is worth and you will often get answers a factor of three apart, not because anybody is lying, but because one divided revenue by logo churn, the other multiplied gross profit by an average tenure, and neither wrote down which they did.
That matters more than it sounds. Lifetime value is the number that decides how much you may spend to acquire a customer, which segments deserve a human touch, and whether a retention project is worth a quarter of engineering time. An inflated CLV does not stay in the spreadsheet; it becomes an acquisition budget that the business cannot actually afford.
This guide covers what customer lifetime value means, the four ways to calculate it and when each one is safe, the assumptions that quietly inflate it, and the four levers, only four, that move it once you trust the number.
Key Takeaways
- CLV is a margin number, not a revenue number. Multiply by gross margin or you are counting your hosting bill as customer value.
- The formula is only as stable as the churn rate underneath it. Dividing by an average churn rate assumes churn is constant, and in most products it is not.
- Segment before you divide. A blended CLV across self-serve and enterprise describes a customer who does not exist.
- The absolute figure means nothing on its own. It only becomes a decision when placed next to acquisition cost and payback period.
- Four levers move it: churn, expansion, price and gross margin. Churn compounds, so it usually wins.
- Most lifetime is lost in week one. Accounts that never reach first value never enter the lifetime you are trying to extend.
What Is Customer Lifetime Value?
Customer lifetime value: definition
Customer lifetime value (CLV, CLTV or LTV) is the total profit a business expects to earn from a single customer across the entire relationship, from the first payment until the day they leave. In subscription software it is normally estimated as the recurring revenue per account, adjusted for the gross margin on that revenue, divided by the rate at which accounts churn.
The definition contains three ingredients, and every argument about lifetime value is really an argument about one of them:
What the customer pays per period. Simple to get from billing, and the only ingredient most teams get right.
The share of that revenue left after the cost of serving them: hosting, third-party APIs, support, onboarding time.
How long they stay, derived from churn. The most fragile of the three, and the one that swings the answer the most.
Get the first and skip the second and you are quoting revenue, not value. Estimate the third from a blended average and you are describing an imaginary customer. Both mistakes push the number in the same direction: up.
Three terms, four levers, and only one of them sits in the denominator.
CLV vs LTV vs CLTV: Does the Acronym Matter?
No. CLV, CLTV and LTV are the same metric under three names, and arguing about which letter belongs where is a good way to avoid the two choices that actually change the answer:
A lifetime value quoted on revenue is larger than one quoted on gross profit by exactly your cost of service. Both are used in the wild. Only one is a value.
Historical CLV sums what customers have already paid: accurate, but only describes people who have already left. Predictive CLV estimates what current customers will pay: useful, but a model.
Write both choices next to the number, permanently. "LTV: $8,400" is a rumour. "Gross-margin CLV, predictive, self-serve segment, Q3 cohorts: $8,400" is a metric somebody can check.
One more distinction worth keeping straight. Lifetime value is a per-customer figure. Net revenue retention is a per-cohort figure that describes how revenue from existing customers moves in aggregate, including expansion. They answer different questions and neither replaces the other, but if your net revenue retention is above 100%, the simple CLV formula below will understate the truth, because it assumes revenue per account stays flat.
How to Calculate Customer Lifetime Value: 4 Formulas
There is no single lifetime value formula, there are four, and they are not competing answers to the same question. Each one buys accuracy at the cost of data you may not have. Start at the top and move down only when the assumption above breaks.
| Method | Formula | Use it when | It breaks when |
|---|---|---|---|
| 1. Simple / heuristic | ARPA × gross margin ÷ churn rate | You need one directional number for a budget conversation | Churn varies by tenure or segment, which it almost always does |
| 2. Historical | Σ (gross profit per period) for customers who have already churned | You have enough completed lifetimes to be representative | Your product is young, or the ones who left were unlike the ones who stayed |
| 3. Cohort / curve | Area under the accumulated gross-profit-per-cohort curve | You have 12+ months of cohorts and churn is front-loaded | You need a single figure fast, or cohorts are too small to be stable |
| 4. Predictive | Modelled per account from usage, plan and tenure signals | You are prioritising accounts, not writing a board slide | Nobody can explain the model; an unexplainable CLV gets ignored |
1. The simple formula
This is the one everybody means when they say "the LTV formula":
Two things to notice. First, 1 ÷ churn is the expected lifetime; the formula is just "monthly gross profit × how many months they stay". Second, the churn rate and the revenue period must match: monthly ARPA with monthly churn, annual with annual. Mixing them is the single most common arithmetic error in lifetime value, and it inflates the result twelvefold.
Use customer churn, not revenue churn, in this formula. Revenue churn nets out expansion, so dividing by it produces a lifetime that already includes upsell; then teams add an expansion assumption on top and count it twice. If you want expansion in the model, use method 3. See user churn for how the two rates differ.
2. The historical calculation
Take every account that has already cancelled, sum the gross profit each one produced across its life, and average. No model, no assumption about the future, just arithmetic on facts.
Its weakness is survivorship in reverse: it can only describe customers who left. In a growing product, your best accounts are still active and therefore excluded, so historical CLV runs low. In a product that recently fixed a bad onboarding flow, it describes a cohort that no longer exists. Use it as a floor, not a forecast.
3. The cohort curve
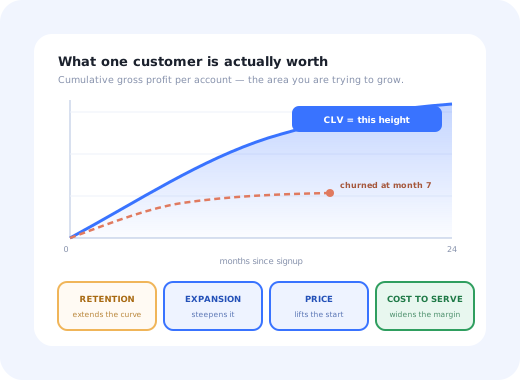
The most honest method available to a team without a data scientist. Group customers by the month they signed up, plot cumulative gross profit per surviving account against months since signup, and read the curve. Because churn is almost always front-loaded, the curve rises steeply and then flattens, and how early it flattens tells you far more than a single average ever will.
Two cohorts of the same product, separated only by whether week one worked.
Reading the curve is the same skill as reading a retention curve, and the mechanics of building the cohorts are covered in our guide to cohort analysis. If the curve never flattens, you do not yet have a lifetime; you have a leak.
4. Predictive CLV
Predictive lifetime value drops the single churn rate and estimates survival per account from its own signals: plan, tenure, seats in use, depth of feature adoption, support load, sentiment. The output is a value per account rather than one number for the business, which is what you want when the question is which accounts deserve attention this month rather than what may we spend on ads.
You do not need a machine-learning pipeline to start. A weighted customer health score multiplied by the segment's baseline CLV is a crude predictive model that beats a blended average, and it has the advantage that a human can explain why an account scored what it scored.
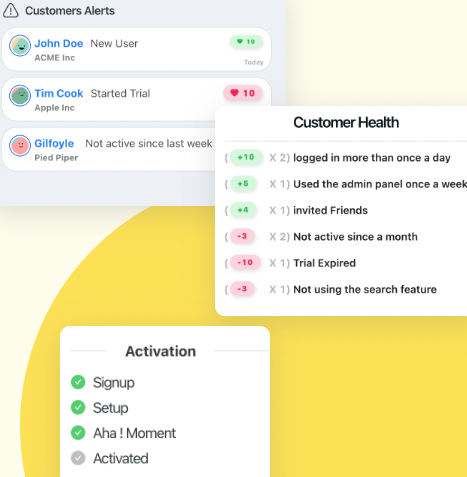
A health score is a predictive CLV model that a human can still argue with.
What Is a Good Customer Lifetime Value?
There is no good absolute number, and anybody quoting one is quoting their own price point. A $400 lifetime value is healthy for a $19/month tool and a disaster for a platform with a six-week sales cycle. CLV becomes a judgement only when you put it next to what a customer costs to win.
- LTV:CAC around 3:1 is the conventional floor for a healthy subscription business, three dollars of lifetime gross profit for every dollar of acquisition cost.
- Below 1:1 means each new customer destroys value; growth makes the problem bigger, not smaller.
- Far above 5:1 is usually under-investment rather than brilliance; the economics could support more acquisition than you are doing.
- Payback period matters independently. A strong ratio with a two-year payback still starves the business of cash.
The full treatment of that ratio, including how to calculate payback properly, is in our guide to customer acquisition cost. The comparison that actually informs decisions is you against yourself: the same definition, the same segments, tracked quarter over quarter.
Why Most Lifetime Value Numbers Are Wrong
Five failure modes account for nearly every inflated CLV. All of them are easy to check, and all of them push the number the same way.
-
Revenue counted as value
No gross-margin term. If it costs you 30 cents of hosting, support and third-party API calls to deliver a dollar, a revenue-based CLV overstates the customer by 30% before any other error.
-
A constant churn rate that is not constant
Dividing by an average assumes an account is as likely to leave in month 30 as in month 2. In reality churn is front-loaded, which means the average understates the survivors and overstates the newcomers, and the blended CLV describes neither.
-
Blending incompatible segments
Self-serve and enterprise accounts have different prices, different churn and different costs to serve. One average across both produces a number that no single customer resembles, and it is usually dragged upward by a handful of large accounts.
-
Extrapolating from a young product
If your oldest cohort is nine months old, you cannot observe a 50-month lifetime; you can only assume one. Cap the horizon at something you have actually seen, and say so.
-
Counting trials and never-activated accounts as customers
Free trials that never converted are not customers with a short lifetime; they never entered the population. Including them halves the number. Excluding the ones who paid once and left inflates it. Define the population before you calculate.
How to Increase Customer Lifetime Value: The Four Levers
Once the number is trustworthy, only four things change it. They are not equally powerful, and they do not take equal effort.
1. Reduce churn, the only lever that compounds
Churn sits in the denominator, so improvements to it are non-linear. Cutting monthly churn from 4% to 2% does not add 50% to lifetime value; it doubles it, because expected lifetime goes from 25 months to 50. Nothing else in the formula behaves like that.
The practical version of this lever is rarely a win-back campaign. It is making sure accounts reach the point where the product is genuinely load-bearing in their week: depth of adoption, not logins. Start with the causes of user churn and work backwards from the ones you can see in product data.
2. Expand accounts after the sale
Seats, tiers and modules raise revenue per account without new acquisition cost, which is why expansion is the cheapest revenue in SaaS. It is also the lever most often executed badly: an upsell prompt shown to an account that has not yet succeeded with what it already bought reads as pressure, not help. The rule is simple: expand accounts that are winning, help accounts that are not. Our guide to in-app upsell covers the timing.
3. Improve gross margin by lowering the cost to serve
This is the quiet lever. Every support ticket deflected, every onboarding call replaced by a guided flow that works, every manual setup automated raises the margin term for every customer simultaneously, including the ones you already have. Two of the biggest line items are usually human onboarding and repetitive support, both of which respond to in-app support and onboarding automation.
4. Price for the value delivered
Raising price raises the numerator immediately, and it is the fastest change on this list to implement and the easiest to get wrong. A price rise that outruns perceived value converts directly into churn, which attacks the denominator harder than the numerator was helped. Treat pricing as a lever you pull after adoption data shows the value is landing, not before.
✅ Do
- Calculate CLV per segment, and publish the definition with the number
- Use gross profit, and state the margin you assumed
- Cap the horizon at a lifetime you have actually observed
- Compare activated and non-activated cohorts; that gap is your business case
- Recalculate after every pricing or onboarding change
❌ Don't
- Divide monthly revenue by an annual churn rate
- Blend self-serve and enterprise into one average
- Use revenue churn in the simple formula, then add expansion on top
- Quote a lifetime longer than your product has existed
- Treat CLV as a target; it is an outcome of four other things
Where to Start: Activation Decides the Lifetime
In most subscription products, the largest single determinant of lifetime value is not what happens in year two. It is whether the account ever reached the point where the product did the job it was bought for. Accounts that never activate do not have a short lifetime; they have almost none, and they drag every cohort average down with them.
That makes the first weeks the highest-leverage place to work on CLV, which is unintuitive for a metric that sounds long-term. Shortening time to value and raising user activation move the steep part of the cohort curve, and everything after it inherits the gain.
The comparison to run this week. Split last quarter's cohorts into accounts that completed setup and reached the value milestone, and accounts that did not. Calculate historical gross profit per account for each group. The difference between those two numbers is what your onboarding is worth in lifetime value, and it is usually the most persuasive slide anyone on a product team can produce.
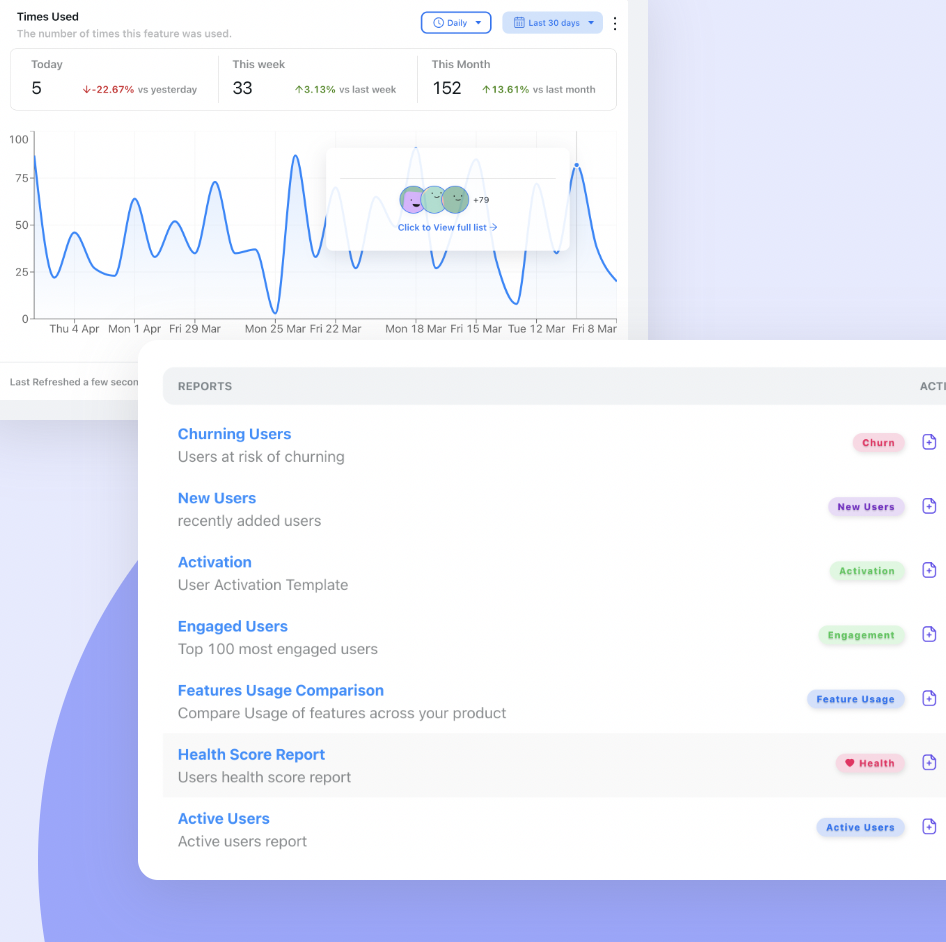
The inputs to lifetime value that billing cannot see: who activated, who quietly stopped.
Measuring the Inputs Without a Data Team
Billing gives you three of the four ingredients: revenue per account, when the relationship started and when it ended. Your finance sheet gives you gross margin. What neither can tell you is why a cohort ended early, and without that, CLV is a scoreboard rather than something you can act on.
The missing half is in-product evidence: which accounts finished setup, which reached the milestone that means value was delivered, which stopped using the features that predict renewal. Kompassify supplies that half without an engineering project: onboarding checklists, product tours, contextual guides and in-app surveys that report their own completion and response rates per segment, so you can compare the lifetime value of accounts that activated against those that never did.
Raise the lifetime, not just the forecast
Kompassify lets product, onboarding and customer success teams build guided onboarding, in-app guidance and surveys, with adoption and completion data on every one, no engineering ticket required. Free up to 100 monthly active users, plans from $129/month, GDPR-compliant and EU-hosted.
Start for free →The One-Sentence Version
Customer lifetime value is gross profit per account divided by the rate at which accounts leave, so calculate it per segment on margin rather than revenue, cap it at a lifetime you have actually observed, and remember that the fastest way to raise it is to stop losing accounts in the first month.
Frequently Asked Questions
What is customer lifetime value?
Customer lifetime value is the total profit a business expects to earn from one customer across the whole relationship, from the first payment to the day they leave. In subscription software it is usually estimated as the average recurring revenue per account, multiplied by the gross margin on that revenue, divided by the rate at which accounts churn. The margin term matters: revenue you spend on hosting and support is not value, and a CLV quoted on raw revenue overstates what a customer is really worth by whatever your cost of service happens to be.
What is the formula for customer lifetime value?
The standard SaaS formula is CLV = (ARPA × gross margin) ÷ customer churn rate, where ARPA is average recurring revenue per account for the period and the churn rate is measured over that same period. A customer paying $200 a month at 80% gross margin with 2% monthly churn is worth ($200 × 0.8) ÷ 0.02 = $8,000. Three variants exist for different situations: a historical version that sums what customers actually paid, a cohort version that reads value off an accumulated-revenue curve, and a predictive version that models each account separately. The simple formula is only trustworthy when churn is roughly stable and you segment before you divide.
What is the difference between CLV and LTV?
Nothing meaningful: CLV, CLTV and LTV are used interchangeably for the same idea, and most teams pick one and stay consistent. The distinction worth caring about is not the acronym but whether the number is measured on gross profit or on raw revenue, and whether it is historical (what customers have already paid) or predictive (what they are expected to pay). Two teams quoting an LTV can differ by a factor of three purely through those two choices, which is why the definition should be written down next to the number.
What is a good customer lifetime value?
There is no good absolute figure, because CLV scales with price point and contract length. It becomes meaningful only against what a customer costs to acquire: a lifetime value of roughly three times customer acquisition cost is the conventional floor for a healthy SaaS business, with the payback period on that acquisition cost ideally under a year. A high CLV with a two-year payback still starves a company of cash. The most useful comparison is your own CLV over time, segmented by plan and acquisition channel, rather than an industry average built on other people's definitions.
How do you increase customer lifetime value?
There are only four levers, and they are not equally powerful. Reducing churn raises the lifetime term and compounds, which is why it usually beats everything else. Expanding accounts raises revenue per account after the sale. Raising prices raises the numerator directly but only holds if perceived value moved with it. Improving gross margin, usually by deflecting support and automating onboarding, quietly raises every customer's value at once. In products where most churn happens early, the highest-leverage work is not a retention campaign at month nine but activation in week one: users who never reached first value never enter the lifetime you are trying to extend.
How do you calculate customer lifetime value without a data team?
Billing already holds most of what you need: revenue per account, plan, start date and cancellation date. That gives you a historical CLV per cohort with a spreadsheet and no pipeline. The part billing cannot tell you is why a cohort ended early, which needs in-product evidence: which accounts completed setup, which reached the milestone that means value was delivered, and which quietly stopped using the features that predict renewal. A tool such as Kompassify supplies that half by reporting completion of onboarding checklists and guides per segment, so you can compare the lifetime value of accounts that activated with those that did not.