Ask any product team whether onboarding matters and you will get an unqualified yes. Ask them what it is worth in money and the conversation stalls. That gap is the reason onboarding loses budget fights to features with a revenue line attached, and it has a specific cause.
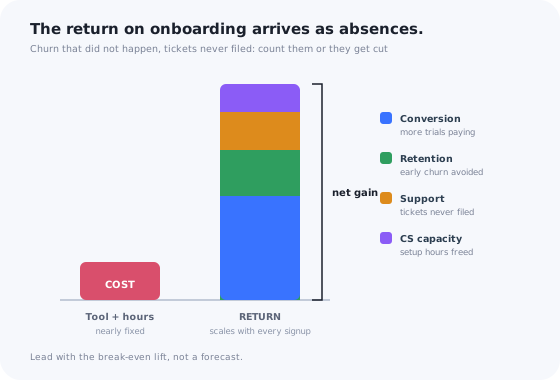
The return on onboarding arrives as absences. Churn that did not happen. Tickets that were never filed. A trial that converted without anyone from sales touching it. Absences do not show up in a dashboard unless someone builds a comparison, and so the value gets felt rather than counted, and things that are felt rather than counted get cut first.
This guide is about counting it. Where the return shows up, how to calculate it without inventing a lift you cannot defend, what the simple model gets wrong, and how to put the case on one page with a pilot that settles it.
Key Takeaways
- Onboarding ROI shows up in four places: trial conversion, early retention, support cost and customer success capacity. Count all four or you will undercount by half.
- Do not forecast the lift; compute the break-even lift. The smallest improvement that pays for the investment is usually tiny, and that number ends most arguments.
- The cost side is small and mostly fixed, which is why the ratio is high: a flow costs the same to build whether it reaches a hundred accounts or ten thousand.
- Attribution is the weak point. A holdout group is the only clean proof; say so in the business case.
- The returns run on different clocks. Tickets move in weeks, conversion in one trial cycle, retention in a quarter. Plan the evidence in that order.
- One page, one pilot, one ask. The business case that gets approved is the one that proposes a six-week test, not a transformation.
What Onboarding ROI Actually Measures
Onboarding ROI: definition
Onboarding ROI is the value created by an onboarding improvement, minus what the improvement cost, divided by that cost. The value is the difference between what new accounts do with the improved onboarding and what they would have done without it, converted into money through conversion, retention, support cost and team time. The “would have done without it” is the hard part, and it is why onboarding ROI is a comparison, not a report.
Two things follow from the definition. First, the ROI of onboarding as a whole is not a useful question: you cannot compare against a product with no onboarding at all. The useful question is the ROI of a specific change: a checklist, a role-based tour, moving the setup from a call into the product. Second, every number in the calculation is a delta. Absolute activation rate tells you nothing about return; activation rate with the change versus without it tells you everything.
This is also why the cost of onboarding and the return on it are separate questions. The cost guide asks what you spend per account to get them live. This guide asks what you get back when you spend it better.
The Four Places the Return Shows Up
Most onboarding business cases count one of these, usually activation, and lose the argument because the number looks small next to a feature. Count all four. They are not alternatives; a single onboarding change usually moves several at once.
| Return | The metric that moves | Where the money is | How fast it shows |
|---|---|---|---|
| 1. Conversion | Activation rate, trial-to-paid | More new revenue from the same signups | One trial cycle |
| 2. Retention | Churn in months one to three | Revenue that would have left, and the lifetime behind it | One quarter |
| 3. Support cost | Tickets and calls per new account | Support hours, and the tooling they need | Weeks |
| 4. CS capacity | Hours per account to go live | Accounts per CSM; expansion the freed hours find | One or two onboarding cycles |
1. Conversion: the same signups, more of them paying
A user who reaches the product's first real value inside the trial converts at a very different rate from one who does not, and the job of onboarding is to move people across that line. The financial value of a point of trial conversion is simple to state: extra paying accounts, times what they pay, times how long they stay. It is the return that is easiest to sell and easiest to measure, and it is rarely the largest.
2. Retention: the churn that does not happen
Early churn is mostly onboarding failure that took a few months to show. Accounts that never reached the habit-forming action leave when the invoice arrives, and by then the cause is invisible. An improvement to the first week moves the retention curve for every cohort that follows, which is why this return is usually the biggest and always the slowest to appear.
3. Support cost: the tickets never filed
New users ask the same questions in the same order, and every one of them is a ticket, a chat or a call with a cost attached. Guidance placed where the question arises, a tooltip on the confusing field, a checklist step that explains the setup, removes the question rather than answering it faster. In-app support is the return that shows first, because the ticket either arrives this week or it does not.
4. Customer success capacity: hours that stop being spent on setup
In any product with a human onboarding step, a large share of customer success time goes on walking accounts through configuration that a checklist could carry. Moving the repeatable part into the product does not remove the human; it changes what the human does, from clicking through setup to handling the accounts whose situation is genuinely unusual. The return is measured in accounts per CSM, and in the expansion conversations the freed hours make possible. The digital customer success guide covers the model this makes possible.
The ROI Formula, Step by Step
The model below is deliberately simple, because a simple model with honest inputs beats a sophisticated one with invented ones. Six steps. The example numbers are illustrative; use your own.
1. Establish the baseline
Five numbers, from the last full quarter: new signups (or trials) per month, activation rate, trial-to-paid or signup-to-paid conversion, churn in the first three months, and tickets per new account in the first month. Add customer success hours per account if you have a human step. If you cannot produce these, the first investment is measurement, and the onboarding metrics guide is where to start.
Illustration: 1,000 signups a month, 10% convert to paid, average revenue per account $80 a month, average paying lifetime 18 months, 8% of new paying accounts churn in their first quarter, 1.2 support tickets per new signup at $12 per ticket.
2. Estimate the lift for each return, honestly
This is where business cases go wrong. Do not take a lift from a vendor's page or an industry statistic; those describe someone else's product. Use one of three sources, in order of preference: a pilot you ran (see below), a segment comparison from your own data (users who completed the checklist versus those who did not, with the caveat that completers are self-selected), or a conservative range with the break-even lift computed alongside it.
Illustration, as a conservative range: conversion from 10% to 11%, first-quarter churn from 8% to 7%, tickets per signup from 1.2 to 1.0.
3. Value each lift in money
Conversion: extra paying accounts per month, times revenue per account, times expected lifetime. In the illustration, one extra point on 1,000 signups is 10 more paying accounts a month, at $80 for 18 months: $14,400 of lifetime revenue added per month of signups.
Retention: paying accounts saved from early churn, times revenue, times the remaining lifetime they now have. One point of first-quarter churn on 100 new paying accounts is one account a month, at $80 for roughly 15 remaining months: $1,200 per monthly cohort. Small per cohort, but it compounds across every cohort that follows.
Support: tickets avoided, times cost per ticket. 0.2 fewer tickets on 1,000 signups is 200 tickets a month, at $12: $2,400 a month.
Customer success: hours freed per account, times accounts, times loaded hourly cost, if you have a human step. Leave it at zero if you do not; do not pad the model.
4. Add up the cost side
The tool, at the plan your volume needs. The time to build and maintain the flows: a realistic number of hours from whoever owns onboarding, at their loaded cost, for the first month and then for ongoing upkeep. And the honest opportunity cost: if engineering has to build any of it, the feature that does not ship. The build versus buy guide is the place to cost that last line properly; it is usually the largest and the most underestimated.
Illustration: a no-code onboarding tool at $129 a month, plus twenty hours of a product manager's time in month one and four hours a month after, at a loaded $80 an hour: about $1,700 in month one and roughly $450 a month thereafter.
5. Compute ROI and payback
Monthly return in the illustration: $14,400 in added lifetime revenue from conversion, $1,200 from retention, $2,400 from support, against roughly $450 a month in cost after the first month. The payback on the first month's $1,700 arrives inside that first month on the support saving alone, before any conversion effect is counted. The ratio is large, and the reason is structural rather than optimistic: the cost is nearly fixed while the return scales with every signup that passes through.
6. Run the sensitivity: what if the lift is a third of that?
Divide every lift by three and re-run. If the case still clears, it is robust. If it collapses, you were relying on the forecast, and you need the pilot before the budget. In the illustration, a third of the conservative lift still returns several times the cost, which is typical for onboarding and is the reason the next section exists.
The cost bar barely registers against the return because it does not grow with volume. Conversion dominates in this example; in a product with a human onboarding step, the customer success bar can be the largest.
The Break-Even Lift: The Number That Ends the Argument
Every forecast invites the question “how do you know it will improve by a point?” and the honest answer is that you do not. So stop forecasting. Turn the model around and ask: how small a lift would pay for this?
Take the monthly cost and divide it by the monthly value of a single unit of improvement. In the illustration, one extra paying account is worth $1,440 in lifetime revenue, so the ongoing cost of about $450 a month is covered by roughly one third of one additional conversion a month, out of a thousand signups. Put as a rate, the break-even lift on conversion alone is about three hundredths of a percentage point. Support alone: the cost is covered if the change removes about forty tickets a month from a queue of twelve hundred.
This is the sentence to lead the business case with: “For this to lose money, it would have to convert fewer than one extra account in three months, and remove fewer than forty tickets a month. Here is why we think it will do considerably better than that.” It moves the burden of proof from an optimistic forecast to a pessimistic floor, and floors are much easier to defend.
The break-even framing also exposes the real risk in onboarding investment, which is not that the tool fails to return but that nobody uses it: flows get built once and never revisited, and the return decays as the product moves on. That is a governance problem, and the case should name the owner.
What the Simple Model Gets Wrong
A model this simple has known failure modes. Naming them in the business case makes it more credible, not less, because the person reading it will think of them anyway.
-
Attribution
Users who complete a checklist convert better, but they were also the users most likely to convert. Self-selection inflates any before-and-after comparison. Only a holdout separates the effect of the onboarding from the intent of the user.
-
Lag
Retention gains appear a quarter after the change, and if the business case promises them in month one it will look like a failure at the first review. Sequence the evidence: tickets first, conversion second, retention last.
-
Double counting
An account that converted because of better onboarding and then stayed because of it should be counted once, in conversion with its full lifetime, not again in retention. Keep the retention line for accounts that would have converted anyway and then left.
-
Treating saved hours as cash
A ticket avoided does not reduce payroll; it frees a person to do something else. Count support and customer success savings as capacity unless you actually plan to reduce headcount, and say what the capacity will be used for.
-
Survivorship in the baseline
If the baseline retention figure comes only from accounts that reached the invoice, it is already filtered. Measure early churn from the paying cohort's first day, not from the accounts still around to be surveyed.
-
Decay
A flow built for last year's interface returns less every release until it is maintained. Put the upkeep hours in the cost side and an owner in the plan, or the ROI is a one-quarter number.
How to Write the Business Case in One Page
The business case that gets approved is short, proposes a test rather than a transformation, and asks for one specific thing. The structure below fits on a page, and the order is the order a sceptical reader asks the questions in.
| Section | What it contains | Length |
|---|---|---|
| 1. The problem, in one number | The single baseline figure that hurts most: “62% of trials never reach a first report.” | One sentence |
| 2. The mechanism | Why they do not, and the specific change that addresses it. Not “better onboarding”: “a setup checklist with the import step first, and a tooltip on the field 40% of tickets mention.” | One paragraph |
| 3. The break-even | The smallest lift that pays for it, and the model behind it in three lines. | Three lines |
| 4. The evidence so far | Whatever you have: a segment comparison, support ticket themes, session recordings. Labelled honestly as suggestive. | Two or three bullets |
| 5. The pilot | One segment, one flow, six weeks, a holdout, and the number that decides success in advance. | One paragraph |
| 6. The ask | The tool cost, the hours, the owner, and the decision date. | Three lines |
| 7. The risks | Attribution, lag, decay, and what you will do about each. | Three bullets |
Two things are missing from that structure on purpose. There is no industry benchmark, because the reader cannot verify it and it invites a debate about someone else's product. And there is no full-year forecast, because the pilot will replace it with a real number in six weeks. A business case that promises less and proposes a way to find out more is the one that survives the meeting.
Running a Pilot That Proves It
The pilot is the argument. Everything before it is a reason to run one. Six decisions make a pilot credible.
1. One change, one segment
Pick the onboarding change with the shortest feedback loop and the clearest mechanism, typically a checklist or a role-based tour aimed at the activation step where most users stall, and apply it to one well-defined segment of new signups. Several changes at once cannot be attributed.
2. A holdout, if you can
Show the new onboarding to a share of new signups and keep the rest on the current experience. The A/B testing onboarding guide covers how to do this without leaving the control group with nothing. If a holdout is impossible, compare consecutive cohorts and list everything else that changed in the period.
3. The success number, written down in advance
Decide before the pilot what result counts as success: a stated lift in activation, a stated drop in tickets per signup. Deciding afterwards produces a result that is always a success and convinces nobody.
4. Six weeks, or one full trial cycle
Long enough for a signup cohort to reach the conversion decision, short enough that the organisation remembers why it started. Retention will not be visible yet; say so, and plan the three-month check as a follow-up.
5. Step-level measurement
Measure the flow itself, not only the outcome: how many users saw each step, completed it, skipped it, and what they did next. A pilot that fails on the outcome but shows exactly which step lost people is a successful pilot, because it says what to change.
6. A decision date
Put the review in the calendar at the start. Pilots without a decision date become permanent half-measures that are neither rolled out nor rolled back.
Onboarding ROI: Do vs. Don't
Do
- Count all four returns: conversion, retention, support, CS capacity.
- Lead with the break-even lift, not a forecast.
- Sequence the evidence by clock: tickets, then conversion, then retention.
- Put the engineering opportunity cost on the cost side honestly.
- Propose a six-week pilot with a holdout and a pre-agreed success number.
- Name an owner and budget the upkeep hours.
Don't
- Quote a vendor's or an industry's lift as if it were yours.
- Count a converted account again under retention.
- Present saved support hours as reduced payroll.
- Promise retention gains in month one.
- Compare checklist completers to non-completers and call it proof.
- Build the flows once and assume the return holds.
Keeping the Cost Side Small
The ratio in this guide is high because the cost side is small, and the cost side is small only if the onboarding flows can be built and changed without a release. The moment each tour, checklist or tooltip is an engineering ticket, the opportunity cost line dominates and the pilot slips a quarter.
Kompassify keeps that line near zero. Product, support and customer success teams build product tours, checklists, tooltips and announcements in a visual editor, target them by segment, and change them the same day the pilot data says to. The analytics are built for exactly the step-level measurement the pilot needs: how many users started each flow, finished it, skipped it, and where they dropped.
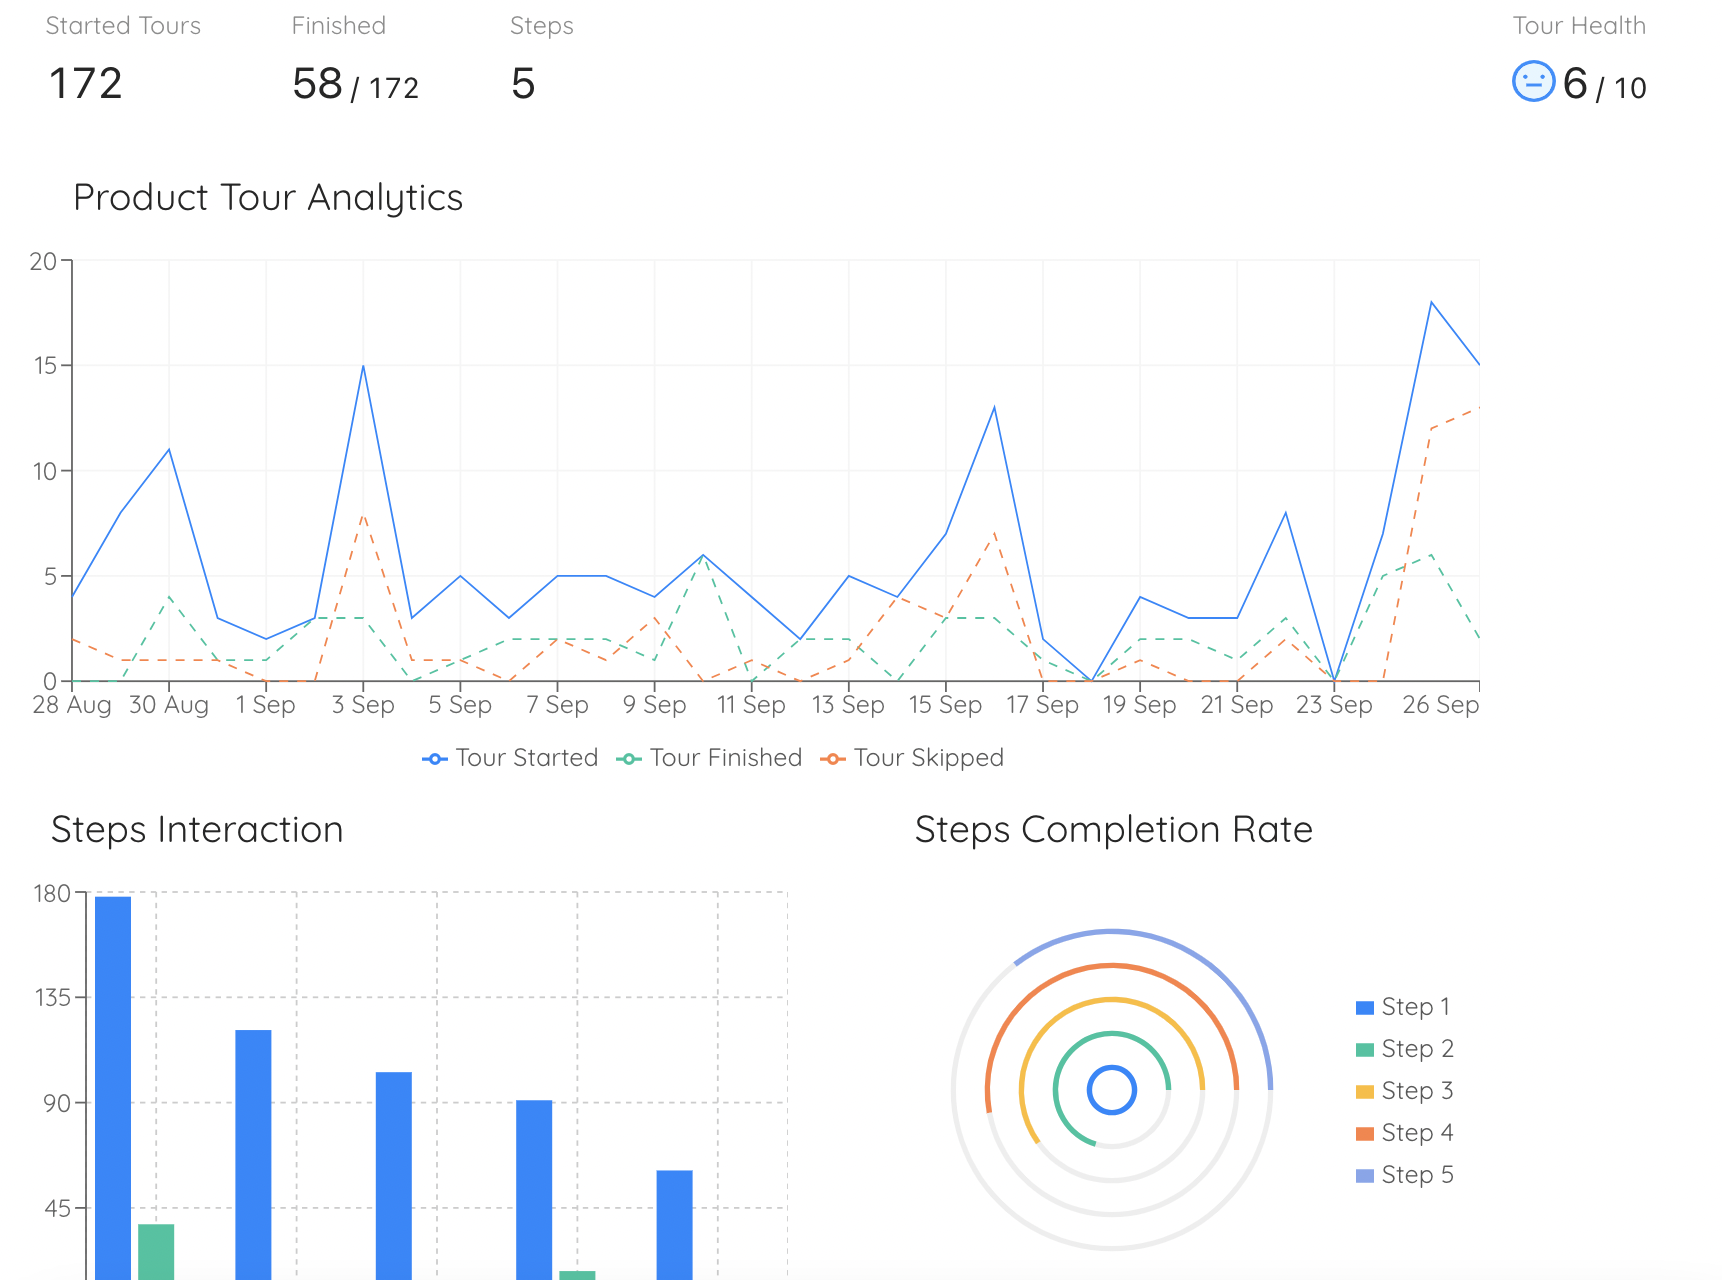
Step-level analytics: started, finished, skipped, and completion per step. The pilot's success number lives here, and so does the step to fix if it misses.
On the cost side of the model, Kompassify is free up to 100 monthly active users, with plans from $129 a month, GDPR-compliant and EU-hosted. That is the tool line in the worked example above, and for most early-stage products it is the entire cost of running the pilot.
Run the six-week pilot without a release
Build the checklist or the tour, target one segment, hold the rest out, and read the step-level results in the same dashboard. Free up to 100 monthly active users, plans from $129/month, GDPR-compliant and EU-hosted.
Start for free →The One-Paragraph Version
Onboarding is under-invested because its return arrives as absences, and absences have to be counted deliberately. The return shows up in four places, trial conversion, early retention, support cost and customer success capacity, on four different clocks, and a business case that counts only one of them undercounts by half. Build the model from your own baseline, value each lift in money, put the tool, the hours and the engineering opportunity cost on the other side, and then stop forecasting: compute the break-even lift, which is usually a fraction of a percentage point, and lead with it. Name the weak points, attribution, lag, double counting and decay, before the reader does. Then propose one change to one segment for six weeks with a holdout and a success number written down in advance, and let the pilot replace the forecast with a fact.
Frequently Asked Questions
What is onboarding ROI?
Onboarding ROI is the value created by an onboarding improvement, minus what the improvement cost, divided by that cost. The value shows up in four places: more trials or signups converting to paid, fewer accounts churning in their first months, fewer support tickets and calls from new users, and fewer customer success hours spent on setup that the product could have covered. The cost side is the tool, the people-time to build and maintain the flows, and the opportunity cost of what else those people would have done. Most of the return is an absence, churn that did not happen or tickets never filed, which is why it needs a comparison group to be seen.
How do you calculate the ROI of user onboarding?
Start from a baseline: current trial-to-paid conversion, activation rate, early churn, tickets per new account and customer success hours per account. Estimate the lift for each honestly, ideally from a pilot rather than a benchmark. Value each lift in money: extra conversions times average revenue times expected lifetime, saved churn times revenue, tickets avoided times cost per ticket, hours freed times loaded hourly cost. Add the four, subtract the cost of the tool and the time, and divide by the cost. Then compute the break-even lift, the smallest improvement that pays for the investment, because that number is usually easier to defend than a forecast.
What is a good onboarding ROI?
There is no universal benchmark, and any figure quoted without your own numbers behind it should be treated as marketing. The useful comparison is internal: an onboarding improvement competes with other uses of the same budget and the same people, so it needs to clear the return of the next best option, not an industry average. In practice the ratio tends to be high because the cost side is small relative to the revenue an onboarding flow touches: a change that reaches every new account for months costs about the same to build whether it reaches a hundred users or ten thousand.
How long does it take to see a return on onboarding?
The returns arrive on different clocks. Support ticket reduction is visible within weeks, because new users either ask the question or they do not. Activation and trial conversion move within one trial cycle, typically a few weeks. Retention takes longer, because you are waiting for the months in which the churn would have happened not to produce it; three months is usually the earliest a retention effect is credible. Build the business case with the fast signals as early evidence and the retention gain as the larger, later confirmation, and set expectations that way.
How do you prove that onboarding caused the improvement?
With a comparison group. Give the new onboarding to a share of new signups and hold the rest on the current experience for the length of one trial cycle, then compare activation, conversion and tickets between the two cohorts. If a holdout is politically impossible, use a before-and-after comparison of consecutive cohorts and be explicit about what else changed in the period, such as pricing, a campaign or a release. Attribution is the weakest part of any onboarding ROI claim, and naming the weakness in the business case makes the rest of it more credible, not less.
Is onboarding software worth it for a small SaaS?
Usually more so than for a large one, because a small team cannot afford the alternative. Without a no-code onboarding layer, every tour, checklist and tooltip is an engineering ticket competing with the roadmap, so onboarding improvements simply do not ship. With one, the product or support person who already knows where users get stuck can fix it the same week. The cost side is small at low volume, several tools including Kompassify are free under a usage threshold, and the return is measured against the same conversion and churn numbers that decide whether a small SaaS survives.